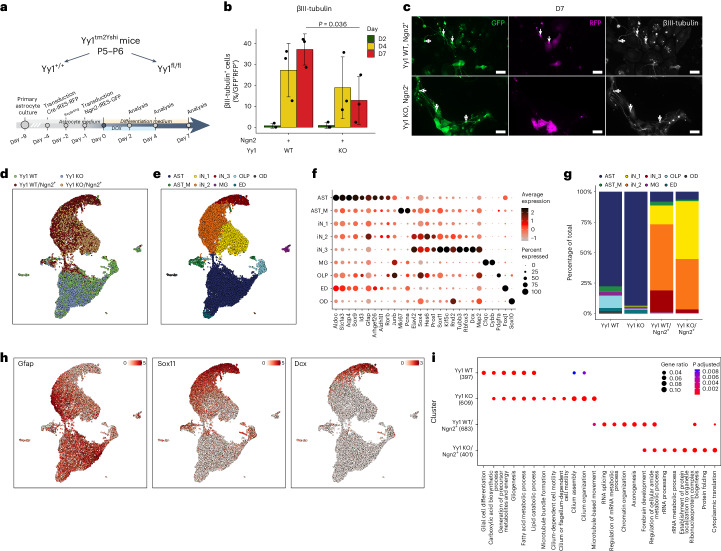
Fig. 7. Successful murine glia-to-neuron reprogramming requires Yy1.
a, Scheme of the experimental design. b, Quantification of the proportion of GFP+RFP+ immunopositive for βIII-tubulin. Data are plotted as mean ± s.d.; each dot represents an individual biological replicate (n = 3). Statistical significance was calculated using a linear regression model. c, Representative micrographs of immunocytochemistry as indicated at 7 dpi of Ngn2 (GFP+) in the indicated conditions. The filled arrow indicates βIII-tubulin+ iNs in the double-transduced (GFP+RFP(Cre)+) cells; the empty arrow indicates βIII-tubulin+ iNs transduced only with Ngn2 (GFP+). Scale bar, 50 µm. Immunostainings were independently replicated (n = 3). d, Single-cell RNA-seq UMAP projection of the indicated experimental conditions. e, Same as d but for the identified cell type clusters. f, Dot plot showing the proportion of cells (as a percentage, size of dots) and the expression levels of selected marker genes in respective cell type clusters. g, Stacked bar plot depicting the proportion of the cell types in the respective experimental conditions. h, UMAP visualization of the expression of the indicated marker genes. i, Bubble plot depicting the GO term enrichment in the indicated experimental conditions. D, day; KO, knockout; WT, wild-type.

