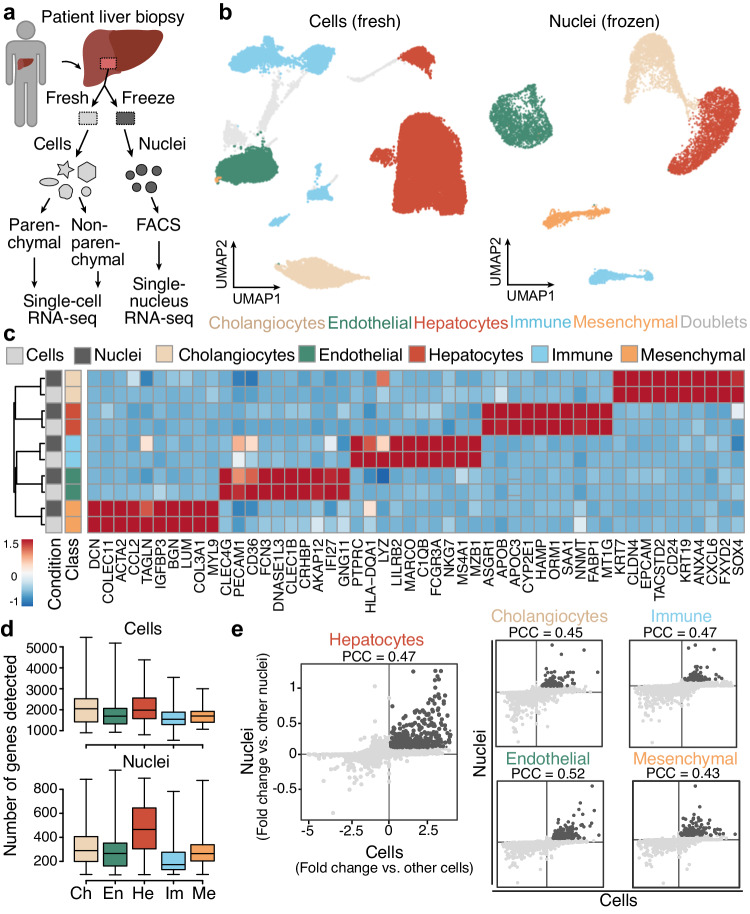
Fig. 1. Fresh single-cell and frozen single-nucleus RNA-seq reveal major cell populations in adult healthy liver specimens.
a Single-cell and single-nucleus RNA-seq experiments were performed on patient-derived fresh (n = 3) and frozen (n = 3) liver tissues. Prior to single-cell RNA-seq, cells isolated from the fresh tissue were partitioned into parenchymal (hepatocytes) and non-parenchymal (other hepatic cell types) fractions (left). Prior to single-nucleus RNA-seq, nuclei from snap-frozen tissues were isolated using fluorescence activated cell sorting (right). b UMAP plot of transcriptomes from fresh (left) and frozen (right) tissue datasets colored by major cell type (see Supplementary Figs. 1, 2 for each donor’s representation). Gray represents potential doublets. c Scaled expression of marker genes per major cell type across fresh and frozen tissue data (cells and nuclei are represented in rows, genes in columns). d Number of detected genes per cell (top) and nucleus (bottom) across major cell types. Ch cholangiocytes, En endothelial cells, He hepatocytes, Im immune cells, Me mesenchymal cells. Boxplot shows the median (center line), 25th, and 75th percentile (lower and upper boundary), and the whiskers indicate the minimum and maximum values. e Comparison of marker gene detection is shown for each major cell type in fresh and frozen samples (dark gray represents genes shared between both experimental setups; PCC, Pearson correlation coefficient). Source data are provided as a Source Data file for (b–e).

