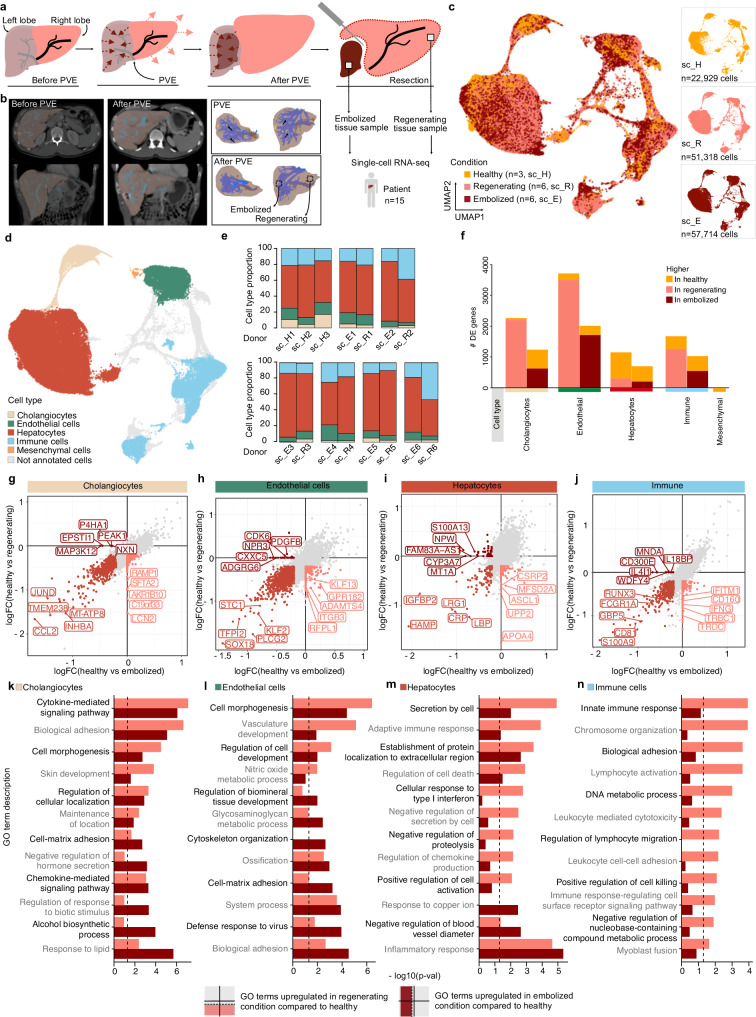
Fig. 2. Transcriptional landscape of human liver cells after portal vein embolization (PVE).
a Schematic shows the portal vein embolization (PVE) procedure and tissue sampling for the scRNA-seq experiments. Portal vein branching toward diseased liver tissue (left lobe) prior to resection is blocked or embolized. Adjacent tissue with redirected blood flow (right lobe) expands over time. ScRNA-seq is performed on two samples derived from regenerating and embolized liver tissues on the day of liver resection. b Computed tomography (CT) scans of pre-PVE (left) and post-PVE (middle) livers are shown along with 3D tissue reconstructions (right), respectively. UMAP plot of merged healthy (n = 3), regenerating (n = 6) and embolized (n = 6) fresh liver samples, colored by condition (c) and major cell type (d). e Major cell type proportion per donor and condition. f Number of differentially expressed genes between healthy and regenerating or embolized samples per major cell type. Gene expression log fold change for each PVE condition compared to healthy (x-axis: embolized; y-axis: regenerating) for cholangiocytes (g), Endothelial cells (h), Hepatocytes (i), and Immune cells (j). k–n, Enriched gene ontology terms for DE genes per major cell type, comparing regenerating or embolized to healthy. Top 6 terms were selected for each condition (two-sided hypergeometric test, dashed line shows Benjamini-Hochberg adjusted p = 0.05). Source data are provided as a Source Data file for (c, d–n).

