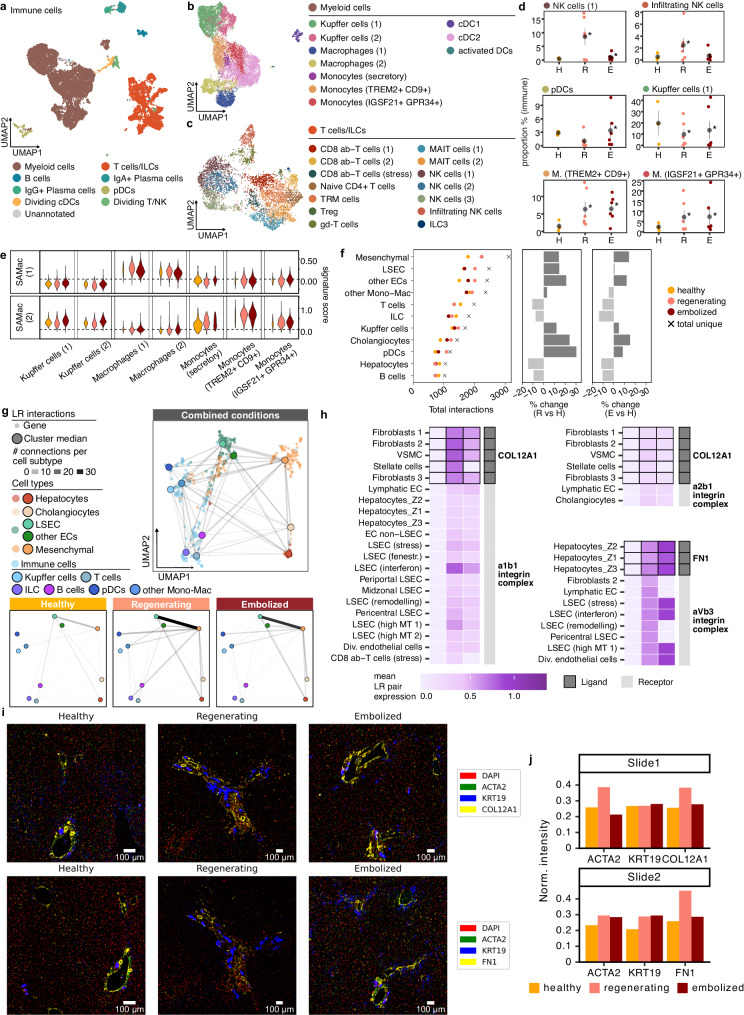
Fig. 5. Intercellular signaling map reveals fibroblast and immune-cell coordination of response to PVE.
UMAP plots for all immune cells (a), and the myeloid (b) and lymphoid (c) subsets, colored by the respective annotations. d Changes in proportions for select immune cell populations. Gray point shows mean and standard error intervals. * denotes a significant difference compared to healthy (two-tailed binomial test, p < 0.05). H healthy, R regenerating, E embolized. e Scar-associated macrophage (SAMac) signature scores in myeloid cell populations, in each condition. f Number of interactions involving each major cell type, in each condition and in total (left dotplot), along with variation in the number of interactions between healthy and regenerating (middle) or embolized (right). g UMAP plot showing all and condition-specific ligand-receptor interaction networks, summarized by cell type. h Heatmaps showing mean expression for selected ligand-receptor pairs involving ECM proteins across healthy, regenerating, and embolized conditions. Black outline denotes the cell type uniquely expressing the ligand. Gray sidebar distinguishes expression of ligand and receptor. Additional heatmaps are shown in Supplementary Fig. 15. i Regions of Interest from immunohistochemistry slides for two selected ECM proteins. j Total fluorescence intensity of the three proteins assessed in each immunohistochemistry slide, normalized by total DAPI intensity in the tissue area. Source data are provided as a Source Data file for (a–h).

