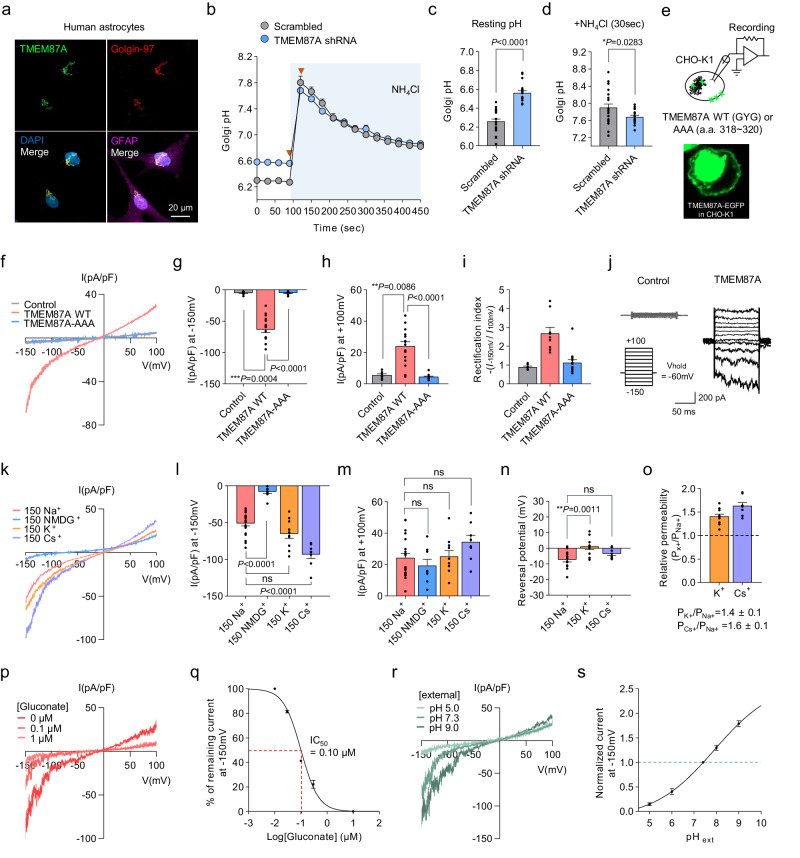
Fig. 1. TMEM87A regulates Golgi pH in human astrocytes and mediates voltage- and pH-dependent, inwardly rectifying cationic currents in CHO-K1 cells.
a Colocalization of TMEM87A with the Golgin-97, Golgi marker, in cultured human astrocytes. b Comparison of resting Golgi luminal pH and buffer capacities under the absence and presence of 50 mM NH4Cl in Scrambled (gray, n = 14 cells) or TMEM87A shRNA (blue, n = 18 cells) transfected cultured human astrocytes expressing B4GALT1-RpHluorin. Arrows indicate time points in (c, d). c Golgi resting pH values. d Golgi pH values after treating the 50 mM NH4Cl at 30 s. c, d n = 21 cells for Scrambled and n = 18 cells for TMEM87A shRNA. e Schematic diagram of whole-cell patch-clamp recording from TMEM87A WT or TMEM87A-AAA (a.a. 318–320) transfected CHO-K1 cell. Inset: fluorescence image of EGFP-tagged TMEM87A. f Averaged I-V relationship from Control (gray), TMEM87A WT (pink), or TMEM87A-AAA (blue) transfected cells under voltage-ramp protocol (from +100 to −150 mV). g, h Current densities measured at −150 mV in (g) and +100 mV in (h). i The rectification index is calculated as the absolute ratio of amplitude at −150 mV over at +100 mV. g–i n = 27 cells for Control, n = 16 cells for TMEM87A WT, or n = 12 cell for TMEM87A-AAA. j Representative currents from Control and TMEM87A WT transfected cells under voltage-step protocol (from +100 mV to −150 mV, 25 mV step). k Averaged I-V relationship from TMEM87A WT transfected cells with bath solutions containing Na+, NMDG+, K+, or Cs+. l, m Current densities measured at −150 mV in (l) and +100 mV in (m). k–m n = 21 cells for Na+ n = 8 cells for NMDG+, n = 10 cells for K+, n = 8 for Cs+. n Reversal potentials measured from TMEM87A WT transfected cells with bath solutions containing Na+ (n = 13 cells), K+ (n = 10 cells), or Cs+ (n = 8 cells). o Relative permeability ratio of Na+ to K+ (PK+/PNa+, n = 10 cells) or Cs+ (PCs+/PNa+,n = 8 cells). p Representative I-V relationship from TMEM87A WT transfected cell with or without gluconate in the bath solution. q Dose-response curve for percentage currents at −150 mV for gluconate concentrations (n = 5 cells). r Representative I-V relationship from TMEM87A WT transfected cell under various pH. s Normalized currents at −150 mV under various pH, normalized to current at pH 7.3 (n = 7 cells). Data were presented as the mean ± SEM. Statistical analyses were performed using two-tailed unpaired t-test in (c) (t = 8.453, df = 37); two-tailed unpaired t-test with Welch’s test (d) (t = 2.189, df = 37); Kruskal–Wallis test followed by Dunn’s multiple comparisons test in g (H = 25.34), h (H = 21.98), i (H = 15.61); one-way ANOVA followed by Dunnett’s multiple comparisons test in l (F(3,43) = 44.10), m (F(3,43) = 2.164), and n (F(2,28) = 7.552). Source data and exact p values are provided as a Source Data file.

