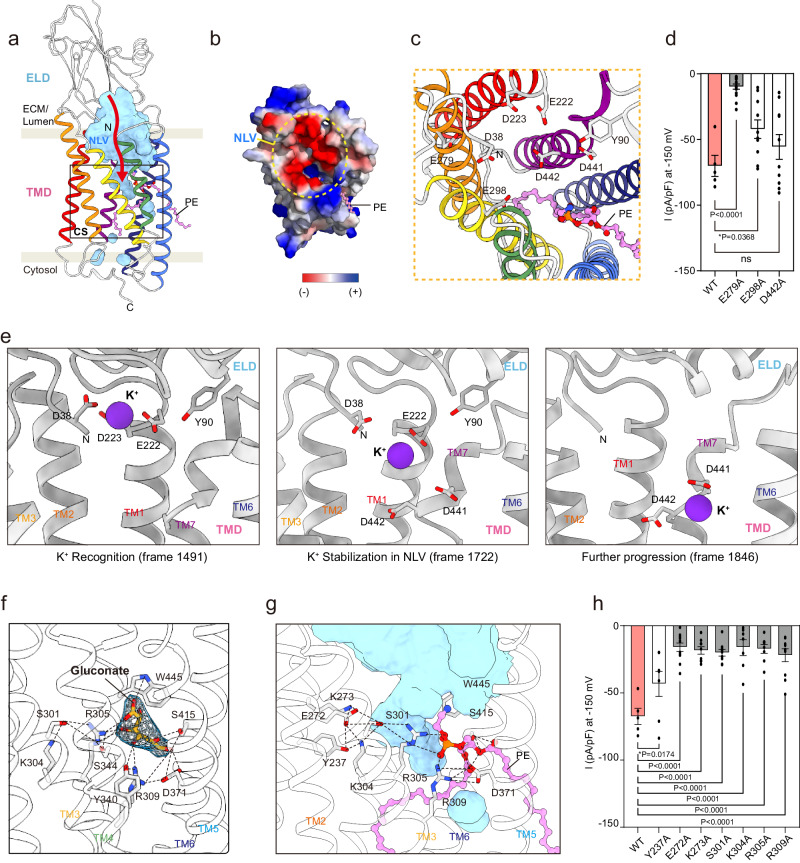
Fig. 4. Putative ion-conducting pathway in hTMEM87A.
a Organization of ion-pathway in hTMEM87A. Water-accessible cavities are shown as a cyan surface, with the putative ion conduction pathway indicated by a red arrow. Negative-charged luminal vestibule (NLV) and constriction site (CS, black-lined box) are labeled. b The surface electrostatic potential of the NLV (yellow dotted circle). ELD and ten residues (R351-S361) are omitted for clarity. c Close-up views of NLV and key negative-charged residues are shown as sticks. d Current density measured at −150 mV for hTMEM87A WT (n = 5) and NLV mutants (n = 15 for E279A, n = 10 for E298A, and n = 10 for D442A). e Representative structures of the K+ conformational dynamics in the NLV of hTMEM87A obtained from GaMD simulations 1. K+ atoms (purple sphere) and their interacting residues (light gray stick) are displayed. TM4 and TM5 are omitted for clarity. f Close-up view of gluconate binding site in hTMEM87A. Gluconate (yellow stick) with cryo-EM density map (contour level = 0.118) and interaction residues (gray sticks) are shown. The hydrogen and ionic bonds are depicted as a dashed line. Helices of hTMEM87A TMD are displayed as transparent cartoons. g Close-up views of the constriction site and the interaction details. Key interaction residues (gray) and PE (pink) are shown as sticks. Cavities are shown as cyan surfaces. Helices of hTMEM87A TMD are displayed as transparent cartoons. TM4 is omitted for clarity. h Current density measured at −150 mV for hTMEM87A WT (n = 5) and CS mutants (n = 7 for Y237A, n = 11 for E272A, n = 9 for K273A, n = 9 for S301A, n = 7 for K304A, n = 8 for R305A, and n = 10 for R309A). Data were presented as the mean ± SEM. Statistical analyses were performed using student one-way ANOVA followed by Dunnett’s multiple comparisons test in d (F(3,36) = 16.64) and h (F(7,58) = 10.84). Source data and exact p values are provided as a Source Data file.

