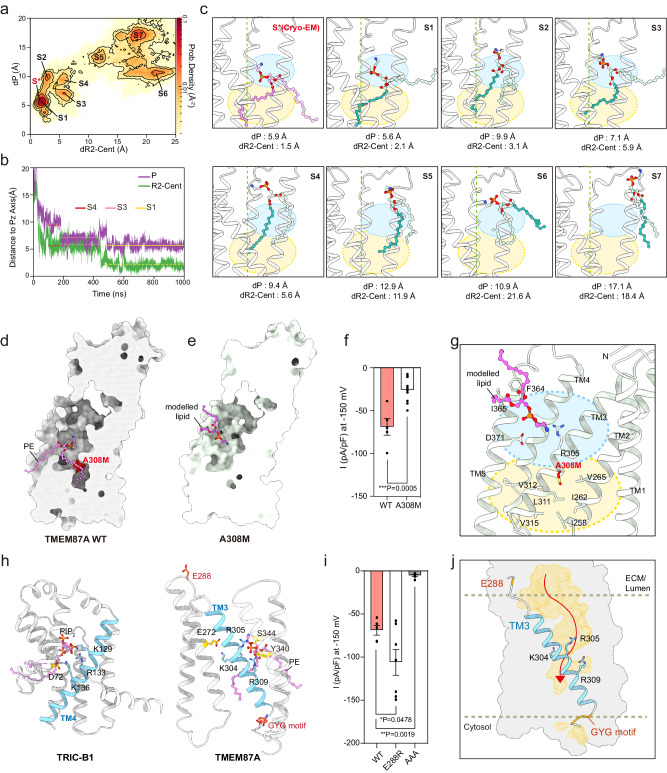
Fig. 5. Role of PE and TM3 in ion conduction in hTMEM87A channel activity.
a 2D histogram of distances (dP and dR2-Cent) for five MD trajectories (5 × 1 μs from system Sp*/L). dP and dR2-Cent are the distances from the phosphorus atom and the center of mass of the R2-fatty acid chain to the smallest-moment principal axis (Pz) of TMD, respectively. PE in cryo-EM structure (red) and seven highly populated states of PE are labeled (from S1 to S7). b Variations of distances of dP and dR2-Cent as a function of time along one trajectory. States of S4, S3, and S1 are indicated by horizontal lines. c The conformational snapshots of PE in seven different states (S1–S7). PE from cryo-EM structure (pink) and MD simulations are displayed as sticks [the phosphorus atom (orange), R1-fatty acid chain (light blue), and R2-fatty acid chain (teal)]. Dashed lines indicate Pz of TMD. Calculated distances of P and R2-Cent are indicated. Cyan and yellow colored circles represent hydrophilic and hydrophobic cavities in TMD, respectively. d, e Cross-sectional view of hTMEM87 WT and A308M. The A308M, which blocks the PE chain from entering the inner cavity, is highlighted in red. A modeled lipid in A308M is shown as a pink stick. f Current density measured at −150 mV for hTMEM87A WT and A308M (bottom, n = 5 WT and n = 10 for A308M). g Close-up view of lipid binding site in hTMEM87A A308M. h Voltage-sensing TM4 of TRIC-B1 (left, PDB: 5EGI) and potential voltage sensor in TM3 of TMEM87A (right). The conserved basic residues (cyan), nearby acidic residues (yellow), and phospholipids (pink) are shown as sticks. i Current density measured at −150 mV for hTMEM87A WT (n = 5) and mutants on either ends of TM3 (n = 7 for E288R, and n = 6 for AAA). j Water-accessible cavities (yellow surfaces) with putative ion-pathway (red arrow). PE is omitted to show the unblocked lower hydrophobic cavity. Potential voltage-sensing helix TM3 and conserved basic residues are shown as cyan. Data were presented as the mean ± SEM. Statistical analyses were performed using a two-tailed unpaired t-test in (f) (t = 4.605, df = 13); one-way ANOVA followed by Dunnett’s multiple comparisons test (i) (F(2,15) = 24.74). Source data and exact p values are provided as a Source Data file.

