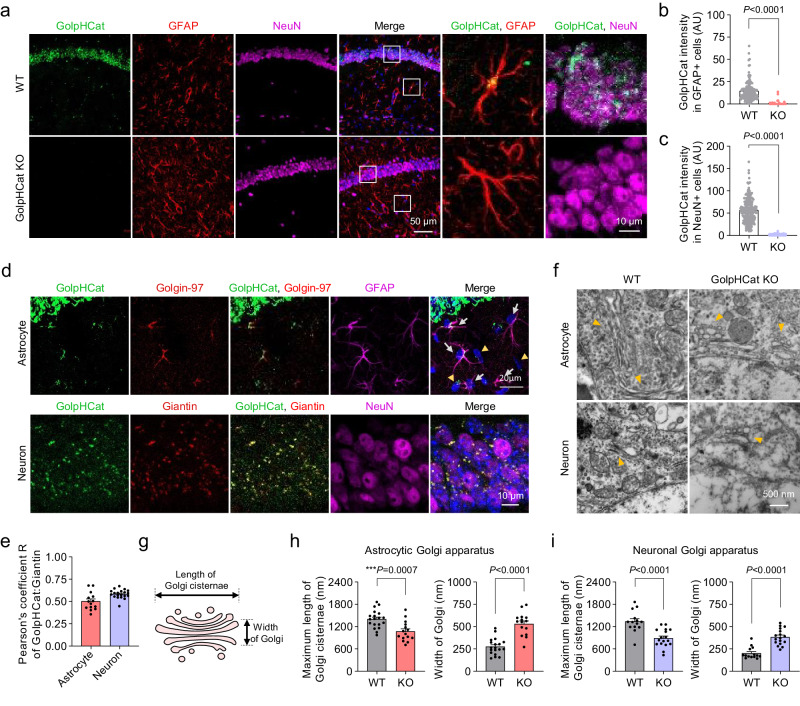
Fig. 6. Disruption of Golgi morphology in hippocampal astrocytes and neurons of GolpHCat KO mice.
a Immunostaining for GolpHCat, GFAP, and NeuN in the hippocampus of WT and GolpHCat KO mice (left). High-magnified images showing colocalization of GolpHCat with GFAP or NeuN (right). b Fluorescence intensity of GolpHCat immunoreactivities in GFAP+ cells of WT (n = 206 cells from four mice) and GolpHCat KO (n = 102 cells from three mice) mice. c Fluorescence intensity of GolpHCat immunoreactivities in NeuN+ cells of WT (n = 241 cells from four mice) and GolpHCat KO (n = 259 cells from three mice) mice. d Colocalization of GolpHCat with Golgin-97 or Giantin in hippocampal astrocyte (GFAP) and neuron (NeuN) of WT mice, respectively. e Pearson’s correlation coefficient for colocalization of GolpHCat and Golgi markers in hippocampal astrocytes (n = 14 cells) and neurons (n = 15 cells) of WT mice. f TEM images of the Golgi apparatus in hippocampal astrocytes and neurons of WT and GolpHCat KO mice. Yellow arrows indicate Golgi. g Diagram of Golgi structure for analysis used in (h, i). h Maximum length of Golgi cisternae (left) and width of Golgi (right) in hippocampal astrocytes of WT (n = 19 cells from three mice) and GolpHCat KO (n = 15 cells from three mice) mice. i Maximum length of Golgi cisternae (left) and width of Golgi (right) in hippocampal neurons of WT (n = 14 cells from three mice) and GolpHCat KO (n = 17 cells from three mice) mice. Data were presented as the mean ± SEM. Statistical analyses were performed using two-tailed Mann–Whitney test in b (U = 365.5), c (U = 2), i width (U = 13); two-tailed unpaired t-test in (h)-length (t = 3.778, df = 32), (h)-width (t = 6.739, df = 32), (i)-length (t = 4.741, df = 29). Source data and exact p values are provided as a Source Data file.

