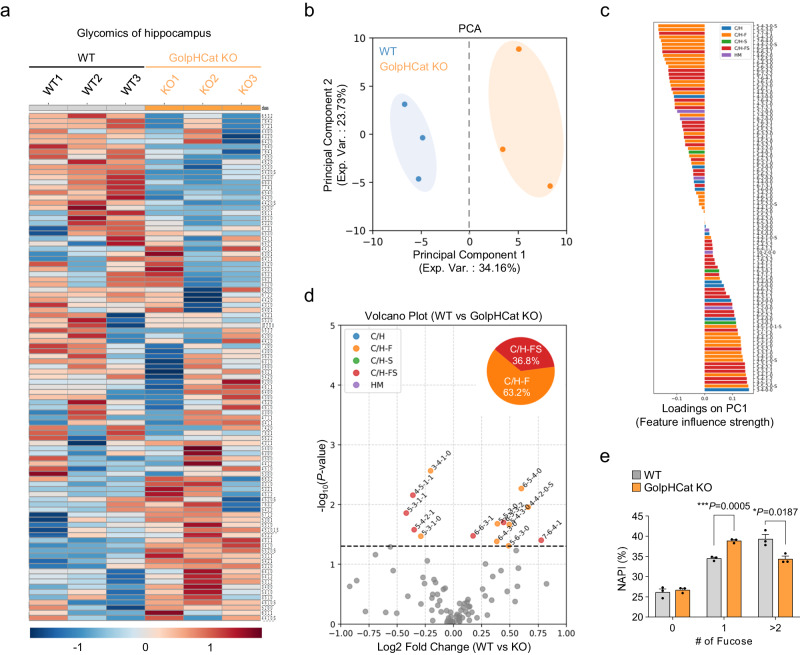
Fig. 7. A deficit of GolpHCat altered glycosylation in the hippocampus.
a–e Comparison of 99 N-glycans found in the hippocampus of WT (n = 3 mice) and GolpHCat KO (n = 3 mice) mice. a Heat map for the hierarchical clustering of N-glycans. The scale bar indicates z-scores of standardized glycan value with higher or lower expressed glycans depicted in red or blue, respectively. (Sugar code: Hex_HexNAc_Fuc_NeuAc_(HexA)_sulfation(S)). b PCA analysis of hippocampus samples between WT and GolpHCat KO. c Feature influence strength for principal component 1 in (b). d Volcano plot. The red dots represent significant expression C/H-F glycans, the orange dots represent significantly expression C/H-FS glycans, and the gray dots represent insignificant expressed glycans. e Comparative distribution of all fucosylated glycans NAPI by the number of fucose residues (n = 3 mice per group). Data were presented as the mean ± SEM. Statistical analyses were performed using two-tailed t-test in (d); two-tailed unpaired t-test in (e) (#0, t = 10.18, df = 4; #1, t = 0.6246, df = 4; #>2, t = 3.827, df = 4). Source data and exact p values are provided as a Source Data file.

