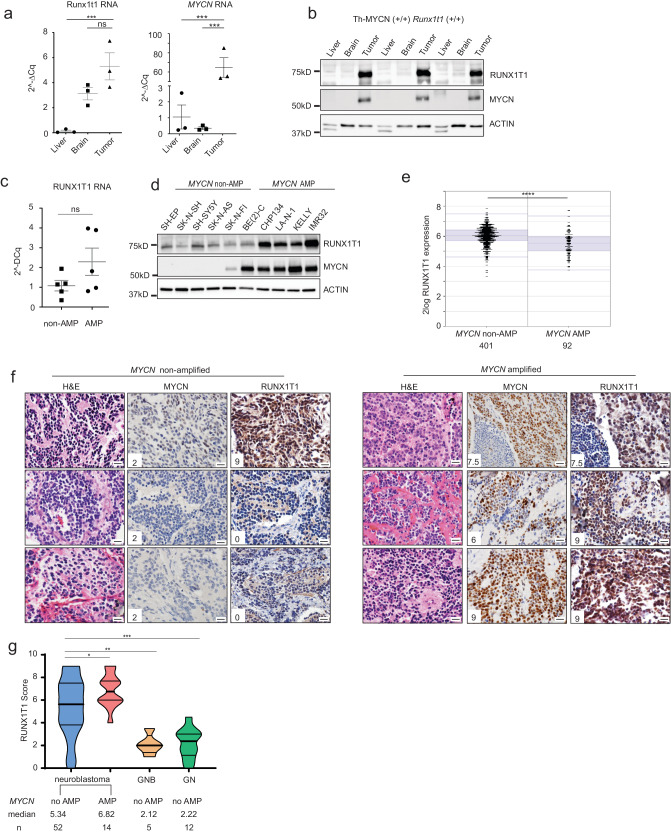
Fig. 3. RUNX1T1 protein level correlates with neuroblastoma aggressiveness.
a Runx1t1 and MYCN mRNA expression in liver, brain, and tumor samples from homozygous Th-MYCN mice with intact Runx1t1 relative to the control, Gusb. Means ± SEM (n = 3) are indicated. Data were analysed using one-way-ANOVA and corrected for the multiple comparison using the Tukey test. ***p = 0.0042, ns p = 0.1385 for Runx1t1; ***p = 0.0006 for MYCN. Three independent mice were used for each tissue. b Western blot for RUNX1T1 and MYCN in liver, brain, and tumor from homozygous Th-MYCN mice; n = 3 independent mice. c RUNX1T1 mRNA expression relative to the control GUSB in MYCN-non-amplified (non-AMP) and amplified (AMP) neuroblastoma cell lines. Means ± SEM (n = 5 data points representing five different cell lines in each group, and the value of each data point is the mean of three biological repeats) are indicated, two-tailed Mann–Whitney test, P = 0.3095. d Western blot for RUNX1T1 and MYCN across a panel of MYCN non-amplified (non-AMP) and MYCN amplified (AMP) neuroblastoma cell lines. This experiment has been repeated once with similar results. e Scatter plot of RUNX1T1 mRNA expression in MYCN non-amplified (non-AMP) and amplified (AMP) tumors from a publicly available dataset (SEQC) of tumor samples from the neuroblastoma R2 database, n = 410 non-AMP and n = 92 AMP samples; two-tailed unpaired t-test, ****p < 0.0001. f A tissue microarray (TMA) of human neuroblastoma tumor samples (n = 66) was stained with antibodies to either MYCN or RUNX1T1. Photos from three representative MYCN-non-amplified samples and three MYCN-amplified samples are shown. Numbers in panels indicate staining intensity. Photos were taken at 600× magnification, and the scale bars represent 20 microns. H&E, hematoxylin and eosin. g RUNX1T1 staining intensity was scored for all samples in the TMA. Neuroblastoma samples were split into non-amplified (n = 52) and amplified (n = 14) and compared to benign diseases of ganglioneuroblastoma (GNB) (n = 5) and ganglioneuroma (GN) (n = 12). Violin plot describes distribution of intensity, width describes frequency of score in tumors. The thick line represents the median, thin line represents the 25th and 75th percentiles. The bounds of the box show the range of scores. Unpaired t-test, two-tailed *p = 0.0403; **p = 0.0064; ***p = 0.0001. Source data are provided as a Source Data file.

