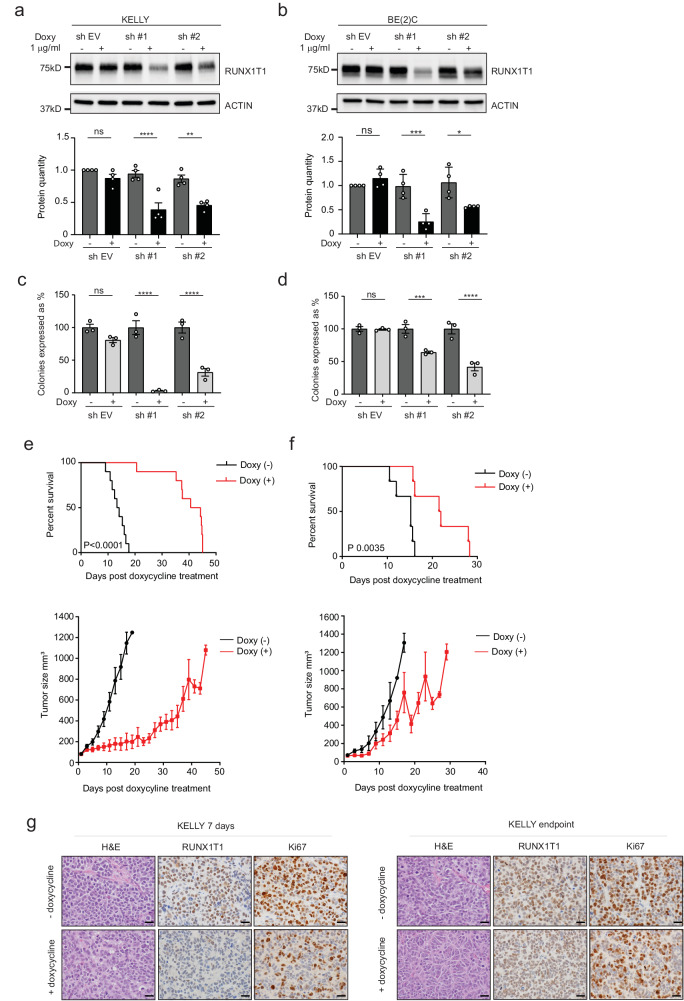
Fig. 5. RUNX1T1 knockdown reduces neuroblastoma cell proliferation both in vivo and in vitro.
a, b RUNX1T1 knock down after 72hrs of doxycycline (1 µg/mL) treatment in KELLY and BE(2)-C cells respectively, with two independent shRNA constructs. Quantitation from four independent experiments demonstrated significantly decreased RUNX1T1 levels following shRNA-mediated knockdown. Values represent means from three independent experiments ±SD. Ordinary one-way ANOVA with Tukey’s multiple comparisons test; KELLY sh#1 ****p < 0.0001, sh #2 **p = 0.0018, ns p = 0. 6962; BE(2)-C sh #1 ***p = 0.0006, sh #2 *p = 0.0295, ns p = 0.8753. c, d Colony formation after doxycycline-induced knockdown of RUNX1T1 in KELLY and BE(2)-C cells respectively, with two independent shRNA constructs. Colonies are represented as a percentage relative to the untreated control in each experiment. Values represent means from three independent experiments ±SD. RUNX1T1 shRNA-mediated knockdown resulted in significantly decreased colony numbers compared to controls. Ordinary 1-way ANOVA with Tukey’s multiple comparisons test; KELLY sh #1 ****p < 0.0001, sh #2 ****p < 0.0001, ns p = 0. 3589; BE(2)-C sh #1 ***p = 0.0005, sh #2 ****p < 0.0001, ns p = 0.8549. e, f Kaplan–Meier survival analysis of NSG mice xenografted with doxycycline-inducible RUNX1T1 shRNA#1 in KELLY and BE(2)-C cells, respectively. Mice were split into two groups (n = 10 mice per group for KELLY and n = 6 mice per group for BE(2)-C) and fed doxycycline or control food once a 50 mm3 tumor was measurable. P values were determined using the Log-Rank (Mantel–Cox) test, p < 0.0001 for KELLY and p = 0.0035 for BE(2)-C. Growth curves (lower panels) plot size over time, post-doxycycline treatment. Graphs are Mean ± SEM. g Representative images of KELLY cells at 7 days and endpoint ± doxycycline. Tumor samples were stained with H&E or immunohistochemically for RUNX1T1 and Ki67. Photos were taken at 600× magnification, and the scale bars represent 20 microns. Source data are provided as a Source Data file.

