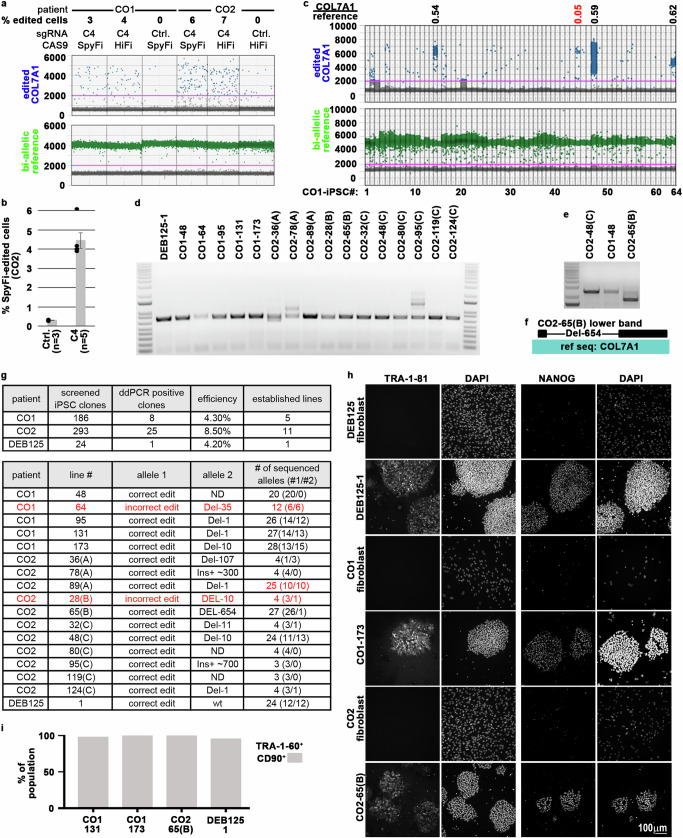
Fig. 2. Successful single manufacturing step editing/reprogramming of patients CO1, CO2, & DEB125.
a COL7A1 editing efficiencies measured by ddPCR in CO1 and CO2 patient fibroblasts after transfection with ssODN(+) and RNPs containing sgRNA C4 and high-fidelity CAS9 HiFi or SpyFi as indicated. A bi-allelic locus (green) is used as a reference for calculating COL7A1 editing (blue) efficiencies, assuming mono-allelic editing events. Ctrls omitted sgRNAs. b Reproducible COL7A1 editing in CO2 patient fibroblasts (as in (a)) with SpyFi CAS9 (n = biological replicates as indicated; mean and SEM are shown). c ddPCR screen of 64 single-step edited/reprogrammed iPS cell lines derived from patient CO1 fibroblasts. Ratios of edited COL7A1 alleles (blue) and a bi-allelic reference locus (green) are used to identify mono- (0.5 + /−0.19) or bi-allelic (1.0 + /−0.19) editing events (black values; red values below/above cutoff indicate mixed or incorrectly edited clones; see Supplementary Fig. 4). d, e Agarose gels visualizing PCR amplicons of a 731 bp (d) and 2418 bp (e) sequence surrounding the edited COL7A1 locus from single-step edited/reprogrammed iPS cell lines derived from three patients. Note some samples yield 2 PCR products, indicative of InDels on one of the COL7A1 alleles. InDels can be substantial (e.g., line CO2-65(B)), so they are only included on bigger (e) PCR products. DNA size references were run in most left (d, e) and right (d) lanes; 100–15,000 bp (d) or 1500–15,000 bp (e) range is shown. f Sanger sequencing of the smaller PCR product from line CO2-65(B) from (e) reveals a large 654 bp deletion. g Summary of single-step editing/reprogramming screens conducted with sgRNA C4/ssODN(+) from three patients as indicated (top). Topo cloning and sanger sequencing of PCR products (d–f) confirm correct COL7A1 editing on target alleles in 15 of 17 single-step edited/reprogrammed iPS cell lines. h Immunofluorescence microscopy images of iPS cells and parental fibroblasts stained for pluripotency markers TRA-1-81 and NANOG from three patients. DAPI visualized DNA, scale indicated. i Summary of flow cytometry analysis of iPS cells from three patients for CD90 and the pluripotency marker TRA-1-60 (see Supplementary Fig. 3d). Source data are provided as a Source Data file.

