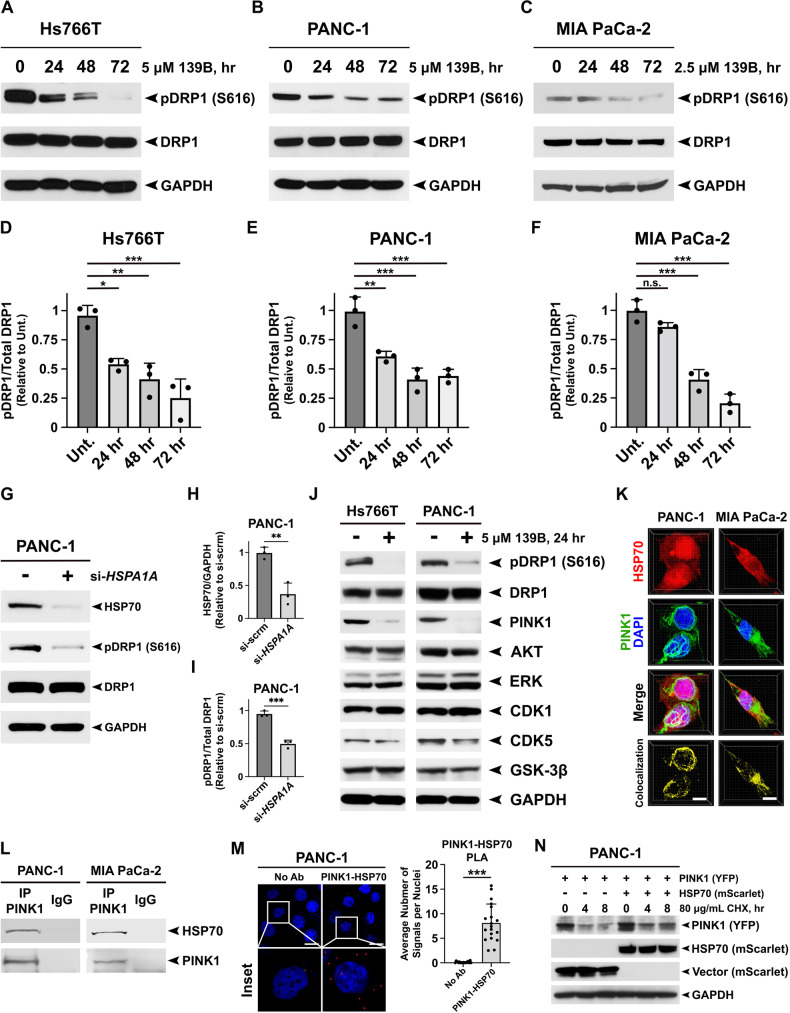
Fig. 3. Genetic or therapeutic ablation of HSP70 impairs the PINK1-mediated phosphorylation of DRP1 at serine 616.
A–C Hs766T, PANC-1, and MIA PaCa-2 cells were treated with the indicated doses of AP-4-139B and harvested every 24 h for 72 h. Cell lysates were subjected to Western blot analysis and immunoblotted for phospho-DRP1 (S616), total DRP1, and GAPDH (loading control). D–F Quantification of (A–C) was performed by obtaining the density of the phospho-DRP1 bands using ImageJ software and normalizing to total DRP1 levels. *p < 0.05, **p < 0.01, ***p < 0.001, n.s. not significant. Shown are quantification of three independent experiments. G PANC-1 cells were transfected with a pool of HSPA1A siRNA and were harvested 48 h later. Cell lysates were subjected to Western blot analysis and immunoblotted for phospho-DRP1 (S616), total DRP1, HSP70 and GAPDH (loading control). H, I Quantification of (G) was performed by obtaining the density of the phospho-DRP1 bands using ImageJ software and normalizing to total DRP1 levels. Quantification of HSP70 was normalized to GAPDH. **p < 0.01, ***p < 0.001. Shown are quantification of three independent experiments. J Hs766T and PANC-1 cells were treated with 5 μM AP-4-139B for 24 h. Cell lysates were subjected to Western blot analysis and immunoblotted for phospho-DRP1 (S616), DRP1, PINK1 (mature form), AKT, ERK, CDK1, CDK5, GSK-3β, and GAPDH (loading control). n = 3 independent experiments. K Co-immunofluorescence (Co-IF) analysis of PANC-1 and MIA PaCa-2 cells immunostained with HSP70 and PINK1, followed by fluorescent secondary staining along with DAPI (blue). Three-dimensional (3D) images were generated using Imaris imaging analysis software. n = 3 independent experiments. Bar scale: 10 µm. L Lysates from PANC-1 and MIA PaCa-2 cells were immunoprecipitated with IgG or anti-PINK1 antibodies and probed for HSP70. M Proximity Ligation Assays (PLA) for HSP70-PINK1 complexes in PANC-1 cells. Individual HSP70-PINK1 interactions are visualized by fluorescent signal (red) with nuclei counterstained with DAPI. Right; quantification of the HSP70-PINK1 interactions measured as the average number of PLA signals per nuclei from over 100 cells analyzed from random fields. n = 2 independent experiments. ***p < 0.001. Bar scale: 20 µm. N PANC-1 cells were transfected with a PINK1-YFP plasmid in the presence or absence of mScarlet-HSP70 plasmid for 48 h. Cells were then treated with 80 µg/mL of cycloheximide (CHX) and lysed at the indicated times following the addition of CHX. Protein levels of PINK1 and HSP70 were measured by Western blot analysis. GAPDH was used as a loading control.

