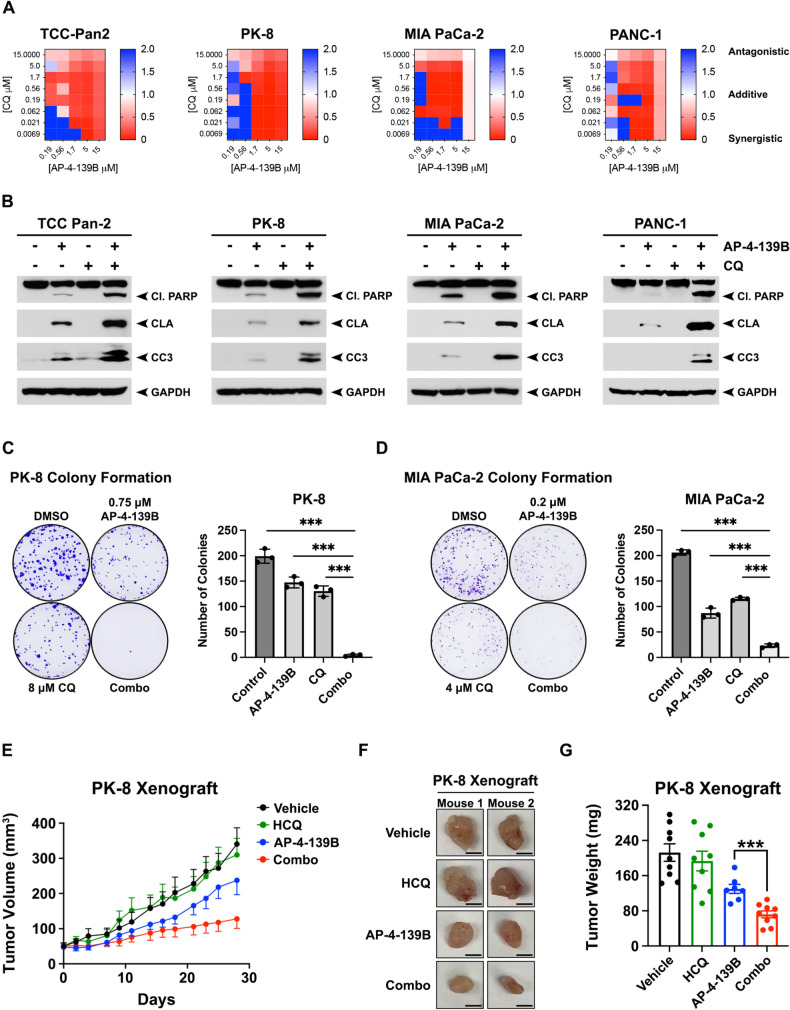
Fig. 7. Dual inhibition of HSP70 and autophagy synergistically impairs the progression of PDAC.
A A panel (n = 4) of PDAC cell lines were treated for 72 h with HSP70i (AP-4-139B) and the autophagy inhibitor CQ at the indicated concentrations. Cells were stained for viability with Calcein and imaged via Celigo image cytometer. Cell numbers at endpoint were normalized to vehicle-treated control (100% growth) for each cell line. Heatmaps representing BLISS independence scores corresponding using proliferation indices for each condition. Scores <1 indicate synergy (red), score = 1 indicated additivity (white), and scores >1 indicate antagonism (blue). n = 3 independent experiments. B PDAC cells (TCC Pan-2, PK-8, MIA PaCa-2) were treated with 5 µM AP-4-139B, 5 µM Chloroquine (CQ), or the combination of the two drugs for 48 h; PANC-1 cells were treated with 7.5 µM of AP-4-139B (139B) and CQ. Lysates were extracted and analyzed for Cleaved PARP (Cl. PARP), Cleaved Lamin A (CLA), and Cleaved Caspase 3 (CC3). GAPDH was used as a loading control. C, D PK-8 and MIA PaCa-2 cells were treated with the indicated doses of AP-4-139B, CQ, or the combination of AP-4-139B and CQ and subjected to colony formation assays. Seven (MIA PaCa-2) to fourteen (PK-8) days later, cells were fixed and stained with 0.1% Crystal Violet. Quantification of each assay is shown to the right of each representative figure. Values shown represent n = 3 for each treatment group ± the SD. *p < 0.05, **p < 0.01, ***p < 0.001. E 5 × 10⁶ PK-8 cells were subcutaneously injected into the flanks of NSG mice (n = 7–9 mice per group). Once tumors reached a size of approximately 50 mm3, mice were randomly assigned to each treatment group: Vehicle, AP-4-139B, Hydroxychloroquine (HCQ), or the combination (combo). Tumor growth was measured using digital calipers. F Images of representative tumors from PK-8 xenograft treatment groups in (E). G Quantification of PK-8 xenograft tumor weights at endpoint. P value is from two-sided, unpaired t-test comparing HSP70i treated to HSP70i plus HCQ treated tumors. Data are shown as mean ± SEM; sample sizes are as in (E).

