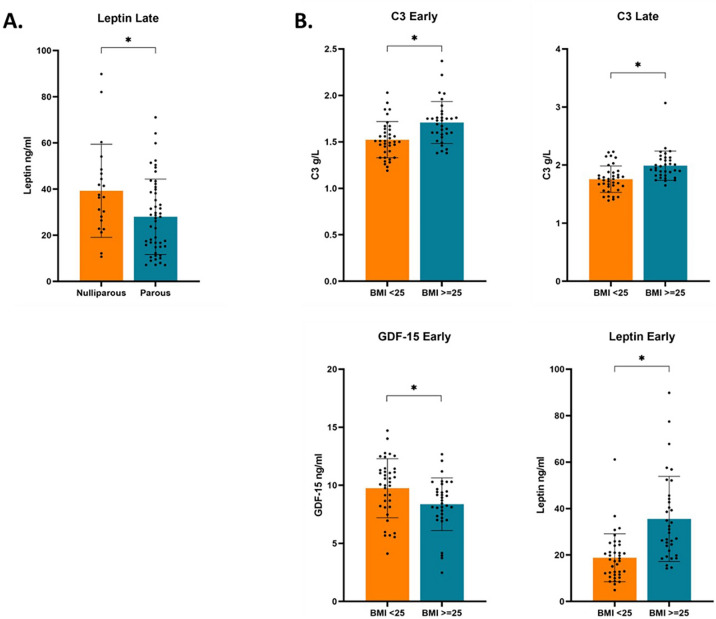
Figure 2.
Differences in serum immune marker concentrations between parity groups and BMI groups. Significant differences in serum immune marker concentrations between parity groups and BMI groups. (A) Difference in late pregnancy serum leptin concentrations compared between nulliparous (n = 21) and parous (n = 51) mothers as determined by Analysis of covariance controlled for baseline (early) levels. Values are shown in Table 3. (B) Serum biomarker concentrations in either early or late pregnancy compared between mothers with a baseline BMI of less than 25 (n = 38), or greater than or equal to 25 (n = 34). Differences in early concentrations between groups were determined by independent t-test for normally distributed variables, or mann–whitney U test for non-parametric variables. Differences in late concentrations between groups were determined by Analysis of covariance controlled for baseline (early) levels. Values are shown in Table 5. Biomarkers with significant differences between BMI groups are shown. The data is presented as mean ± SEM, with each point representing the individual biomarker concentration for each mother. *Significant after Benjamini Hochberg adjustment for multiple comparisons, where the threshold for significance is defined as p < q.

