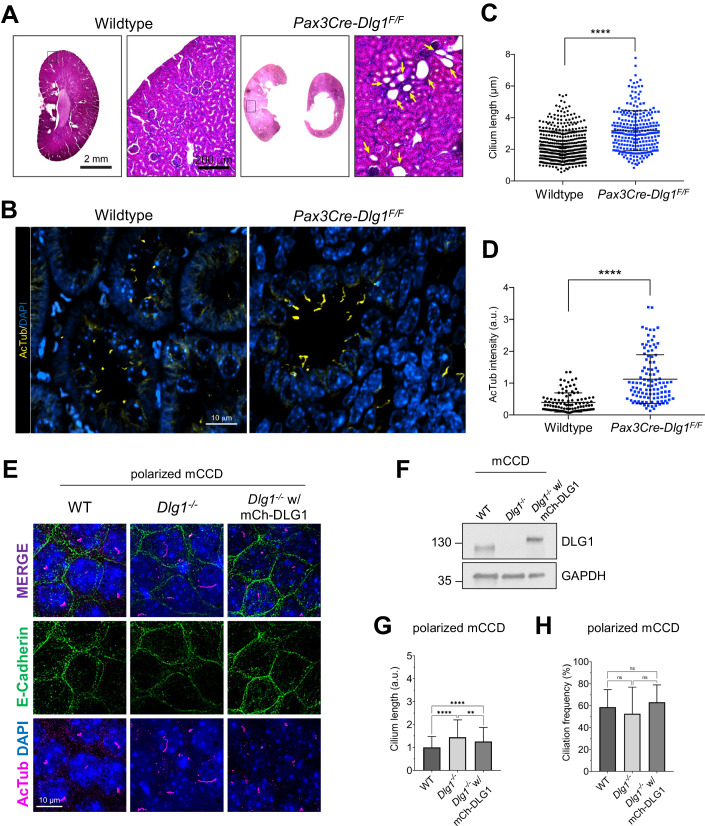
Figure 1. Loss of Dlg1 in mouse kidney cells leads to elongated cilia.
(A) H&E staining of representative kidney sections from wild-type and Pax3Cre-Dlg1F/F mice. Black box denotes regions shown as magnified images on the right. Yellow arrows point to cystic tubules in the cortical region. (B–D) Immunofluorescence staining for cilia (acetylated α-tubulin, yellow) and quantification of ciliary length (C) and ciliary acetylated α-tubulin intensity (D) in kidney sections of wild-type (n = 3) and Pax3Cre-Dlg1F/F (n = 4) mice at 4 months of age. Data are presented as mean ± SD and statistical analysis was performed using Student’s t-test. ****P < 0.0001. (E) Representative image of transwell filter-grown mCCD cell lines (mCh-DLG1: mCherry-DLG1). Cilia were visualized using acetylated α-tubulin antibody (AcTub, magenta), cell–cell contacts were visualized with E-cadherin antibody (green) and nuclei were stained with DAPI (blue). (F) Western blot analysis of total cell lysates of the indicated mCCD cells lines using antibodies against DLG1 and GAPDH (loading control). Molecular mass markers are shown in kDa to the left. (G, H) Quantification of ciliary length (G) and frequency (H) in the indicated transwell filter-grown mCCD lines. Ciliary length and ciliation rate were measured using a fully automated MATLAB script (see “Methods” for details). Graphs represent accumulated data from three independent experiments, and statistical analysis was performed using Mann–Whitney U test (unpaired, two-tailed). Error bars represent mean ± SD. **P < 0.01; ****P < 0.0001; ns, not statistically significant. Source data are available online for this figure.

