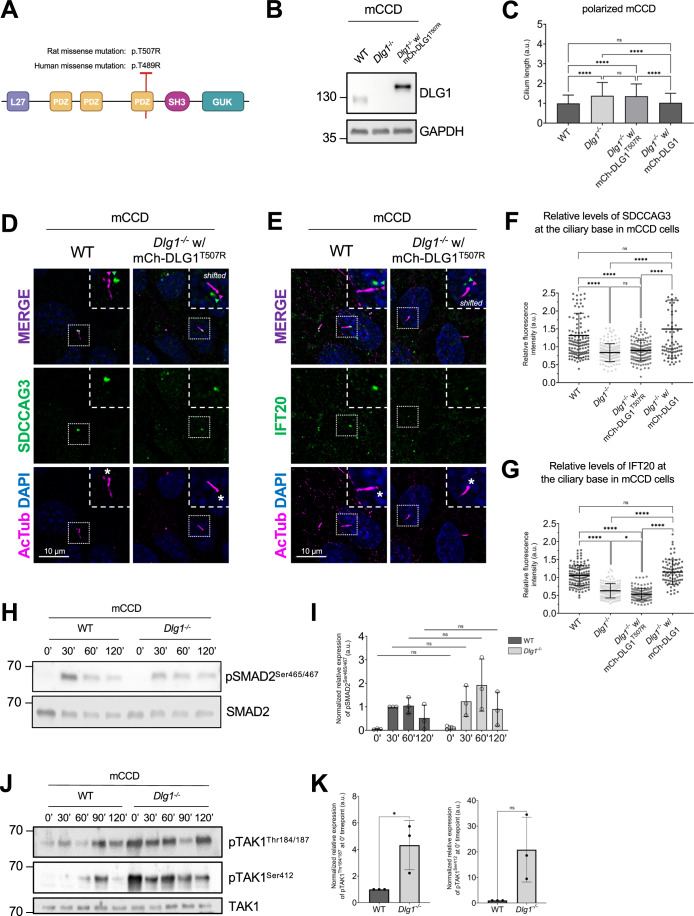
Figure 6. A CAKUT-associated DLG1 missense variant fails to rescue ciliary phenotype of Dlg1−/− mCCD cells.
(A) DLG1 protein domain structure and schematic representation and localization of the human CAKUT-associated DLG1T489R variant and the rat counterpart (DLG1T507R). The specific human WT DLG1 isoform depicted is DLG1-210 (UniProt Q12959-5), which is encoded by transcript ENST00000422288 (ensembl.org) (Nicolaou et al, 2016); the corresponding WT rat DLG1 isoform is UniProt A0A8I6A5M7. (B) Western blot validation of stable expression of transgenic mutant mCherry-DLG1 (mCh-DLG1T507R) in mCCD cells using antibodies as indicated. (C) Ciliary length measurements of indicated cell lines, grown on transwell filters. The ciliary length was measured using the fully automated MATLAB-based quantification. The graphs represent accumulated data of three independent biological replicates. Kruskal–Wallis test with Dunn’s multiple comparison test was used for statistical analysis. Error bars represent mean ± SD. ****P < 0.0001; ns, not statistically significant. (D, E) IFM analysis of the indicated ciliated cell lines using antibodies against SDCCAG3 (D) or IFT20 (E), both shown in green. Acetylated α-tubulin (AcTub, magenta) was used to stain cilia; nuclei were visualized with DAPI (blue). Insets show enlarged images of cilia, while the merged insets show primary cilia with channels shifted to aid visualization. Asterisks mark the ciliary base. (F, G) Quantification of relative MFI of SDCCAG3 (F) and IFT20 (G) at the ciliary base of indicated mCCD cell lines, based on images as shown in (D, E), respectively. Kruskal–Wallis test with Dunn’s multiple comparison test was used for statistical analysis and graphs represent WT normalized and accumulated data of three independent biological replicates, with dots representing total number of cilia analyzed. Error bars represent mean ± SD. ****P < 0.0001; ns, not statistically significant. (H) Western blot analysis of total or phosphorylated (p) SMAD2 upon stimulation with TGFβ-1 ligand for indicated times in growth-arrested mCCD cells. (I) Quantifications of protein phosphorylation shown in (H), which represent WT-30’ normalized and accumulated data of three independent biological replicates. Error bars represent mean ± SD. (J) Western blot analysis of total or phosphorylated (p) TAK1 upon stimulation with TGFβ-1 ligand for indicated times in growth-arrested mCCD cells. (K) Quantifications of protein phosphorylation shown in (J), which represent WT-0’ normalized and accumulated data of three independent experimental replicates. Error bars represent mean ± SD. *P < 0.05; ns, not statistically significant. Source data are available online for this figure.

