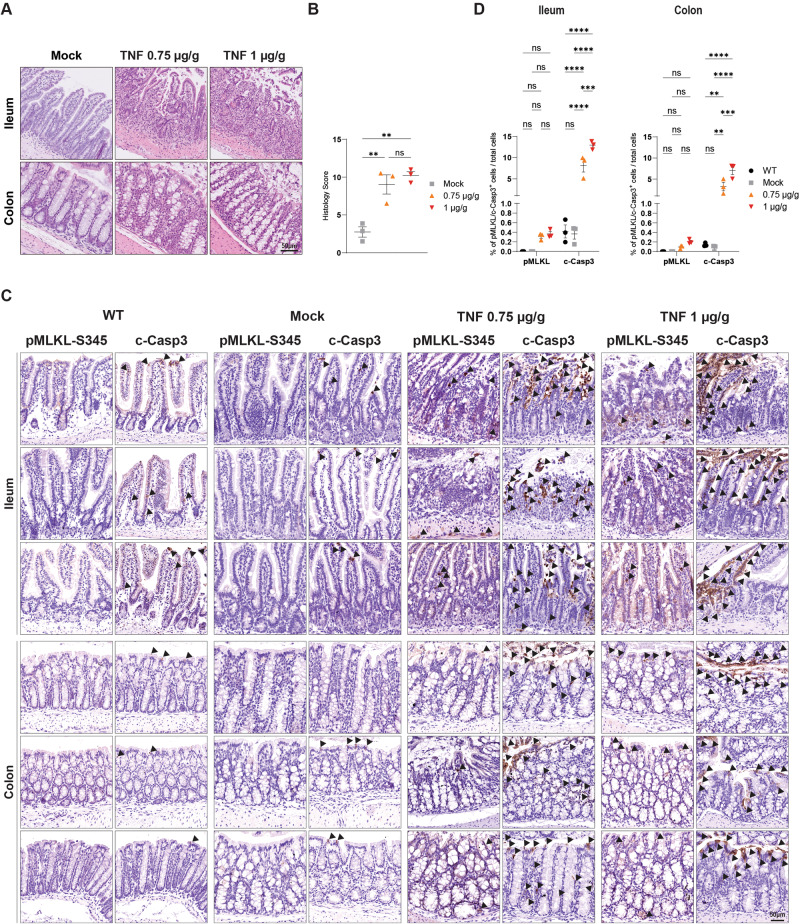
Fig. 6. Systemic inflammatory response syndrome drives apoptosis and not necroptosis in intestinal epithelial cells.
Co-housed 10–12 week old female C57Bl6/N wt mice were injected with 0.75 µg/g or 1 µg/g of ice-cold recombinant, LPS-free mouse TNF intravenously. Control mice received a corresponding volume of ice-cold LPS-free PBS. Mice were sacrificed 6 h post-injection. Untreated wt mice were additionally analysed (n = 3 in each group). A Representative images of small intestine and colon sections (Swiss-rolls) of wt mice as indicated were stained with H&E. Slides were digitalised in a digital slide scanner and pictures were acquired in QuPath. Scale bars: 50 µm. B Graph showing histology score in whole intestine. Data are presented as mean + SEM and each dot represents one mouse. P values were calculated via one-way Anova, Tukey’s multiple comparisons test. **P ≤ 0.01, ns not significant. C Representative images of ileum and colon sections (Swiss-rolls) of wt mice as indicated immunostained with pMLKL-S345 and c-Casp3. Slides were digitalised in a digital slide scanner and pictures were acquired in QuPath. Scale bars: 50 µm. Arrowheads indicate pMLKL-S345-positive cells and c-Casp3-positive areas. D Graph showing quantification of illustrated pictures for each immunostaining obtained via QuPath after slides were digitalised in a digital slide scanner as described in the Supplementary Methods section. Total numbers of cells were obtained to calculate the percentage of positive cells over the total amount of cells detected. Data are presented as mean + SEM and each dot represents one mouse. P values were calculated via two-way Anova, Tukey’s multiple comparisons test. **P ≤ 0.01, ***P ≤ 0.001, ****P ≤ 0.0001, ns not significant.

