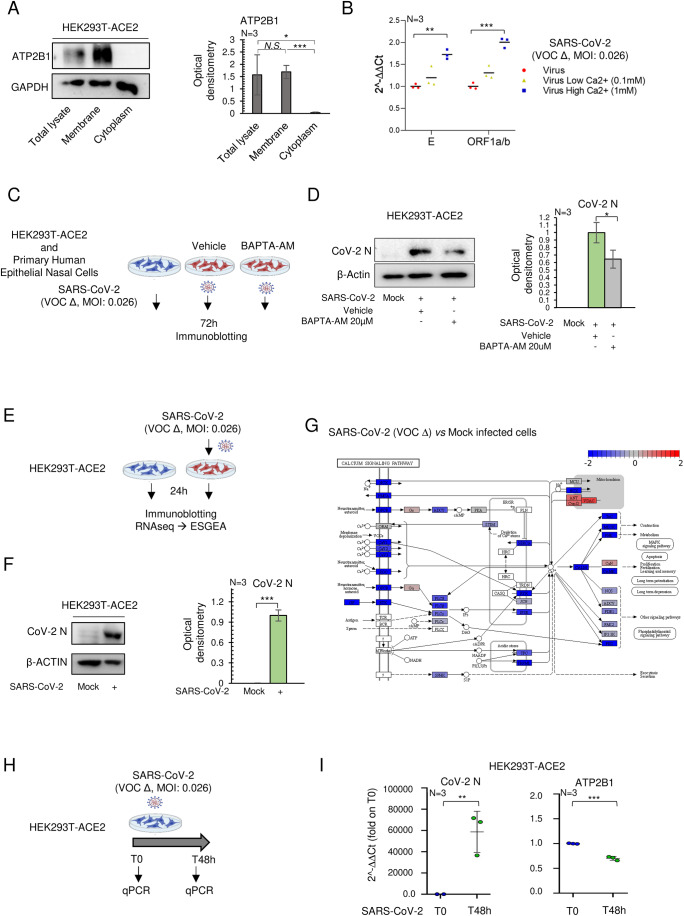
Figure 1. Dysregulated expression of Ca2+ pumps during SARS-CoV- 2 infection, including ATP2B1.
(A) Left: Representative immunoblotting analysis of cytosolic, membrane, and total protein lysate fractions obtained from HEK293T-ACE2 cells, using antibodies against the ATP2B1 protein. GAPDH is used as the loading control. Right: Densitometric analysis of ATP2B1 band intensities. Data are means ± SD of N = 3 biological replicates. Unpaired two‐tailed T Student tests, *P < 0.05; ***P < 0.001, NS not significant. (B) Quantification of mRNA abundance in the presence of increasing amount of Ca2+ (2−ΔΔCt) for the viral CoV-2 E and ORF1a/b genes. qPCR analysis of RNA extracted from HEK293T-ACE2 cells infected with SARS-CoV-2 VOC Delta for 24 h. Scattered plots show individual value and mean as indicated by the horizonal black lines of N = 3 biological replicates. Unpaired two‐tailed T Student tests with Bonferroni correction, **P < 0.01; ***P < 0.001. (C) Experimental design for the HEK293T-ACE2 cells treated with 20 μM BAPTA-AM and infected with SARS-CoV-2 (VOC Delta at 0.026 MOI) for 72 h. Mock-infected cells are used as control. (D) Left: A representative immunoblotting analysis using antibodies against COV-2-Nucleoprotein (CoV-2 N) on total protein lysates obtained from cells treated with BAPTA-AM at 20 μM concentration. Vehicle-treated cells are used as control. β‐Actin is used as the loading control. Right: Densitometric analysis of the CoV-2 N band intensities. Data are represented as means ± SD of N = 3 biological replicates. Unpaired two‐tailed T Student tests with Bonferroni correction, *P < 0.05. (E) Experimental design showing analyses of HEK293T-ACE2 cells infected with SARS-CoV-2 (VOC Delta at 0.026 MOI) for 24 h; mock-treated cells were used as negative control. Total RNA and protein extracted for RNA-seq (Explorative experiment) with ESGEA analyses and immunoblotting. (F) Left: Representative immunoblotting analysis of the CoV-2 N protein in cells treated as in (E). β‐Actin is used as the loading control. Right: Densitometric analysis of CoV-2 N. Data are means ± SD of N = 3 biological replicates. Unpaired two‐tailed T Student tests, ***P < 0.001. NS not significant. (G) The “Ca2+ signaling by reactome pathway” through RNA-seq analyses from the differentially expressed genes in HEK293T-ACE2 cells treated as in (E). Blue, downregulated (blue) and upregulated (red) genes upon SARS-CoV-2 infection are shown. Red circle indicates PMCA family Ca2+ pumps (or ATP2Bs). (H) Experimental design of HEK293T-ACE2 cells infected with SARS-CoV-2 (VOC Delta at 0.026 MOI) for 48 h, RNA extracted at T0 and T48 for qPCR analyses. (I) Quantification of mRNA abundance relative to T0 and T48 (2−ΔΔCt) for the ATP2B1 and CoV-2 N genes in cells treated as in (H). Data are means ± SD of N = 3 biological replicates. Unpaired two‐tailed T Student tests, **P < 0.01, ***P < 0.001. Source data are available online for this figure.

