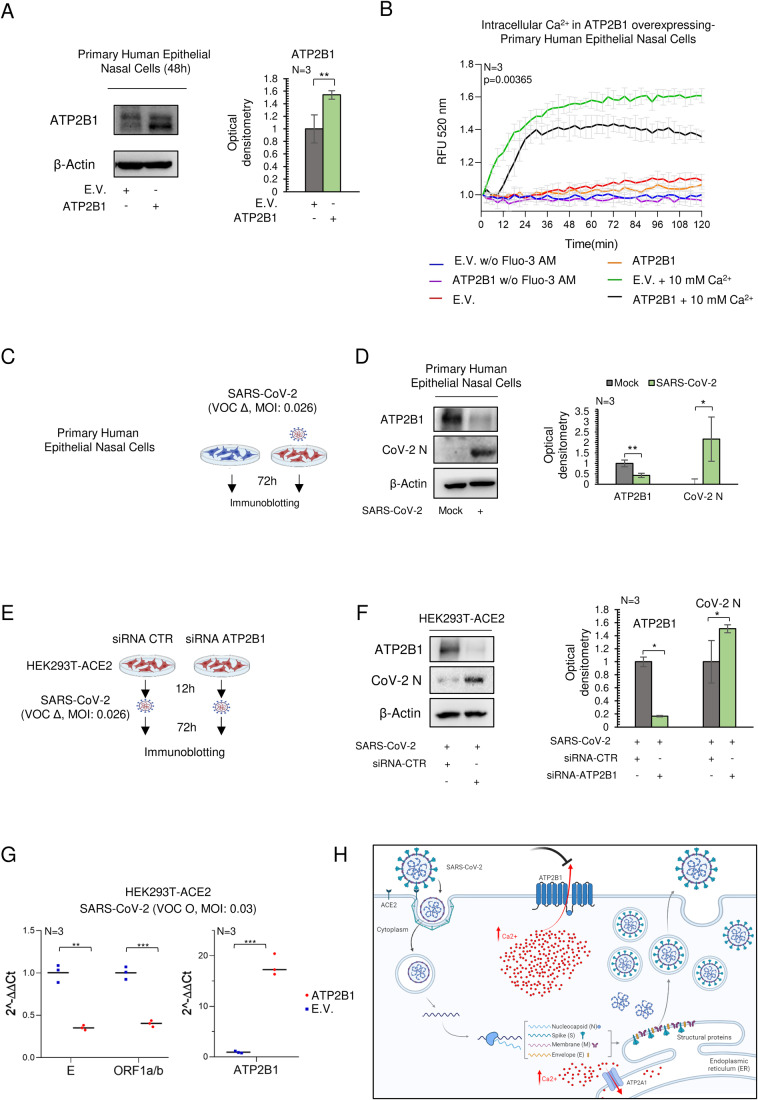
Figure 2. Reduced ATP2B1 protein levels promote SARS-CoV-2 replication via increasing intracellular Ca2+.
(A) Representative immunoblotting analysis using antibodies against ATP2B1 in human primary epithelial nasal cells transiently overexpressing ATP2B1 human gene (48 h). Cells overexpressing the empty vector (E.V.) were used as negative controls. β‐Actin is used as the loading control. Right: Densitometric analysis of ATP2B1. Data are means ± SD of N = 3 biological replicates. Unpaired two‐tailed T Student tests, **P < 0.01. (B) Fluorescence changes relative quantification of intracellular Ca2+ by Fluo3-AM for up to 72 min in human primary epithelial nasal cells overexpressing ATP2B1 (48 h after transfection). Cells overexpressing the empty vector [E.V.] used as negative control. Results are expressed as means ± SEM of N = 3 biological replicates. Fd ANOVA global P = 0.0365, see ATP2B1-overexpressing cell (black line) vs. E.V. (green line) in the presence of 10 mM Ca2+. (C) Experimental design showing primary human epithelial nasal cells infected with SARS-CoV-2 (VOC Delta at 0.026 MOI), mock-infected cells used as negative control. After 72 h proteins extracted for immunoblotting. (D) Left: a representative immunoblotting analysis using antibodies against ATP2B1, CoV-2 N in cells as treated in (C). β‐Actin is used as the loading control. Right: densitometric analysis of ATP2B1 and CoV-2 N. Data are means ± SD of N = 3 biological replicates. Unpaired two‐tailed T Student tests, *P < 0.05, **P < 0.01. (E) Experimental design showing HEK293T-ACE2 cells treated with siRNA against ATP2B1 (or scrambled, CTR) for 12 h, and then infected with SARS-CoV-2 (VOC Delta at 0.026 MOI) for 72 h. (F) A representative immunoblotting analysis using antibodies against ATP2B1 and CoV-2 N from cells treated as in (E). β‐Actin is used as the loading control. Right: Densitometric analysis of ATP2B1 and Cov-2 N. Data are means ± SD of N = 3 biological replicates. Unpaired two‐tailed T Student tests, *P < 0.05. (G) Quantification of RNA level measured by qPCR of viral ORF1a/b and E and human ATP2B1 in HEK293-ACE2 transiently transfected with ATP2B1 gene or empty vector E.V. and infected with SARS-COV-2 VOC Omicron (72 h). Data are means ± SD of N = 3 biological replicates. Unpaired two‐tailed T Student tests, **P < 0.01, ***P < 0.001. (H) Cartoon representation to illustrate our hypothesis about the role of ATP2B1 during SARS-CoV-2 infection. Downregulation of ATP2B1 increased the intracellular Ca2+ levels as observed by the blockage sign (colored black, on top) and resulting on stimulation of SARS-CoV-2 replication with an increased expression of the viral structural genes as represented by enhanced expression of SARS-CoV-2 N protein. Source data are available online for this figure.

