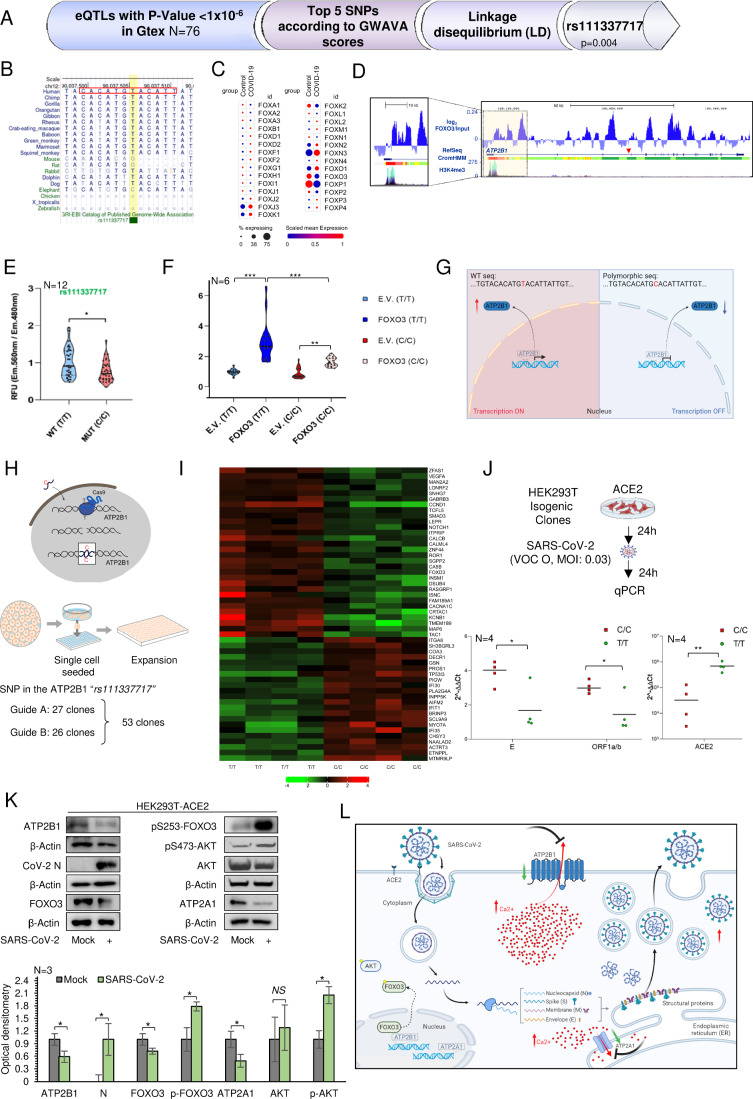
Figure 3. The homozygous intronic ATP2B1 variant rs111337717 is responsible for increased SARS-CoV-2 replication in COVID-19 patients via transcriptional regulation of FOXO3.
(A) In silico analysis pipeline identifying the presence of noncoding variants in the ATP2B1 locus acting as expression quantitative traits (eQTLs) and located in putative elements responsible for transcriptional regulation. EQTLs”, GWAVA, and linkage disequilibrium analyses (LD) are used to identify the rs111337717 SNP in the ATP2B1 locus. GTex database (eQTLs): (P < 1 × 10⁻⁶) (CIS-eQTL mapping for statistical tools, see (Consortium, 2020); COVID-19 severity vs. asymptomatic patients Fisher test, P = 0.0004. (B) Alignment of the sequence genomic region flanking rs111337717 SNP (NC_000012.12: g.89643729 T > C) SNP [(CACATG(T/C)ACATTAT)] shows the conservation through different species sequences through evolution (C) Identification of FOXOs family transcriptional factors (D) CromHMM state segmentation and the H3K4me3 signal (ENCODE), along the ATP2B1 gene in human cells epigenetically analyzed by Genome browser showing accumulation of normalized FOXO3 signal: bright red, promoter; orange and yellow, enhancer; green, transcriptional transition; red arrow, polymorphism- containing region. The expanded view of the highlighted region (left) shows FOXO3 peaks over the ATP2B1 promoter and enhancer regions, as marked by H3K4me3 and CromHMM (red and orange regions), respectively. (E) Luciferase reporter assay for the rs111337717 for both T/T (WT) and C/C (MUT) sequences in ATP2B1 gene as described in Methods section. Data are expressed as means ± SEM of N = 36 (n.12 biological replicates with N = 3 technical measurements). Unpaired or paired T Student test, *P < 0.05. (F) Luciferase reporter assay for the RS111337717 for both “T/T” and “C/C” sequences in HEK293T cells transiently transfected with FOXO3 or Empty Vector (E.V.) for 60 h. Results are expressed as means ± SEM of N = 18 (N = 6 biological replicates with N = 3 technical measurements). One-way ANOVA test in multiple groups comparisons, **P < 0.01, ***P < 0.001. Statistical details: WT T/T vs. WT T/T FOXO3 P < 0.0001; C/C vs. C/C FOXO3 P = 0.0053; WT T/T FOXO3 vs. C/C FOXO3 P < 0.0001. (G) Right: Cartoon representation to illustrate our hypothesis of the “C/C” sequence in the ATP2B1 intronic region and its transcriptional regulation. (H) Schematic illustration for target T to C genome editing by CRISPR/Cas9 in the rs111337717 region. N. 2 guides (A, B) are used to analyze n.53-edited clones (see “Methods”). (I) Heatmap of top differentially expressed (DE) genes comparing HEK293T (WT T/T) and isogenic generated clones (C/C). Colors represent (green, black, and red) as low, intermediate and high gene expression, respectively. Fold change value +/−2. Statistical Mobin Wald test, P < 0.005 Bonferroni corrected of N = 4 different isogenic (T/T and C/C) generated clones. N = 4 biological replicates. (J) A cartoon showing CRISPR/Cas9 genome editing clones (T/T and C/C) transfected with ACE2 carrying plasmid and infected by SARS-CoV-2. Below: qPCR of viral structural genes (ORF1a/b and E) and ACE2 expression in those ACE2 transiently expressing clones infected by SARS-CoV-2 Omicron 5 (see “Methods”). Scattered plots show individual value and mean as indicated by the horizonal black lines of N = 4 biological replicates. Unpaired two‐tailed T Student tests, *P < 0.05; **P < 0.004. Statistical details: CC vs. TT clones: C/C #1; C/C#13, C/C #G; C/C #Q red color vs. T/T WT and T/T #A, T/T #AA, T/T#U green color parental cells. (K) Top: Representative immunoblotting analysis using antibodies against the indicated proteins (ATP2B1, Cov-2 N, FOXO3, pS253-FOXO3, pS473-AKT, ATP2A1) in HEK293T- ACE2 cells infected with SARS-CoV-2 VOC Delta at 0.026 MOI for 72 h. β‐Actin is used as the loading control. Mock-infected cells were used as a negative control. Bottom: densitometric analysis of the proteins as above. Data are means ± SD of N = 3 biological replicates. Unpaired two‐tailed T Student tests, *P < 0.05, NS not significant. (L) Cartoon representation to illustrate our hypothesis for downregulation of ATP2B1 during SARS-CoV-2 infection via FOXO3 transcriptional factor. During SARS-CoV-2 infection, while ATP2B1 is downregulated, (see block sign on top) the PI3K/Akt pathway is activated and enhances the phosphorylation of FOXO3, thus excluding its protein entrance in the nucleus (see dashed lines). As a consequence, the expression of the FOXO3 targets, including ATP2B1 and ATP2A1, are also found downregulated, thus increasing the intracellular Ca2+ levels and further promoting SARS-CoV-2 replication. Source data are available online for this figure.

