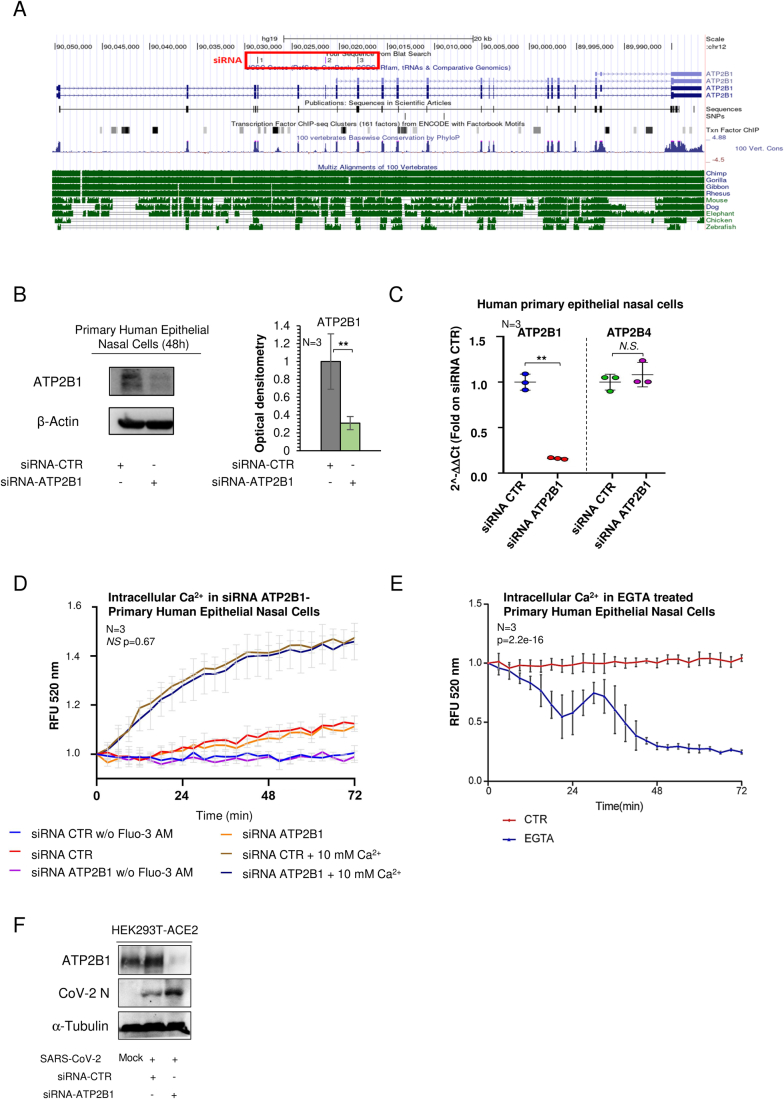
Figure EV2. Reduced ATP2B1 protein levels promote SARS-CoV-2 replication. Related to Fig. 2.
(A) Representation of human ATP2B1 region recognized by siRNA as reported in the UCSC Genome Browser on Human Dec. 2013 (GRCh38/hg38) Assembly (https://genome.ucsc.edu/). At the bottom, the alignment of this genomic region among different species is shown. (B) Left: representative immunoblotting analysis using antibodies against the ATP2B1 protein on human primary epithelial nasal cells transiently treated with siRNA against ATP2B1 (siRNA-ATP2B1) for 48 h. Cells treated with a pool of three unrelated siRNAs (siRNA- CTR) were used as negative controls. β‐Actin is used as the loading control. Right: Densitometric analysis of the ATP2B1 band intensities in blots. Data are means ± SD of N = 3 biological replicates. Unpaired two‐tailed T Student tests, **P < 0.01. (C) Quantification of mRNA abundance for ATP2B1 and ATP2B4 (2−ΔΔCt) in cells as treated as in (B). Data are means ± SD of N = 3 biological replicates. Unpaired two‐tailed T Student t test, **P < 0.01; NS not significant. (D) Quantification of relative fluorescence changes of Fluo3-AM as a measure of intracellular Ca2+ levels in cells treated as in (B) for up to 72 min. Results are expressed as means ± SEM of N = 3 biological replicates. One-way ANOVA and KS test, P = 0.6748; NS = not significant between siRNA control (brown) and siRNA-ATP2B1 (dark blue) in presence of 10 mM Ca2+. (E) Quantification of relative fluorescence changes of Fluo3-AM as a measure of intracellular Ca2+ levels for up to 72 min in human primary epithelial nasal cells treated with EGTA 1 mM. Results are expressed as means ± SEM of N = 3 biological replicates. One-way ANOVA and KS tests, P = 2.2e-16. (F) A representative immunoblotting analysis using antibodies against the ATP2B1 protein for total protein lysates obtained from cells treated as described in Fig. 2E. α-Tubulin is used as loading control. Mock-infected cells are used as control. Source data are available online for this figure

