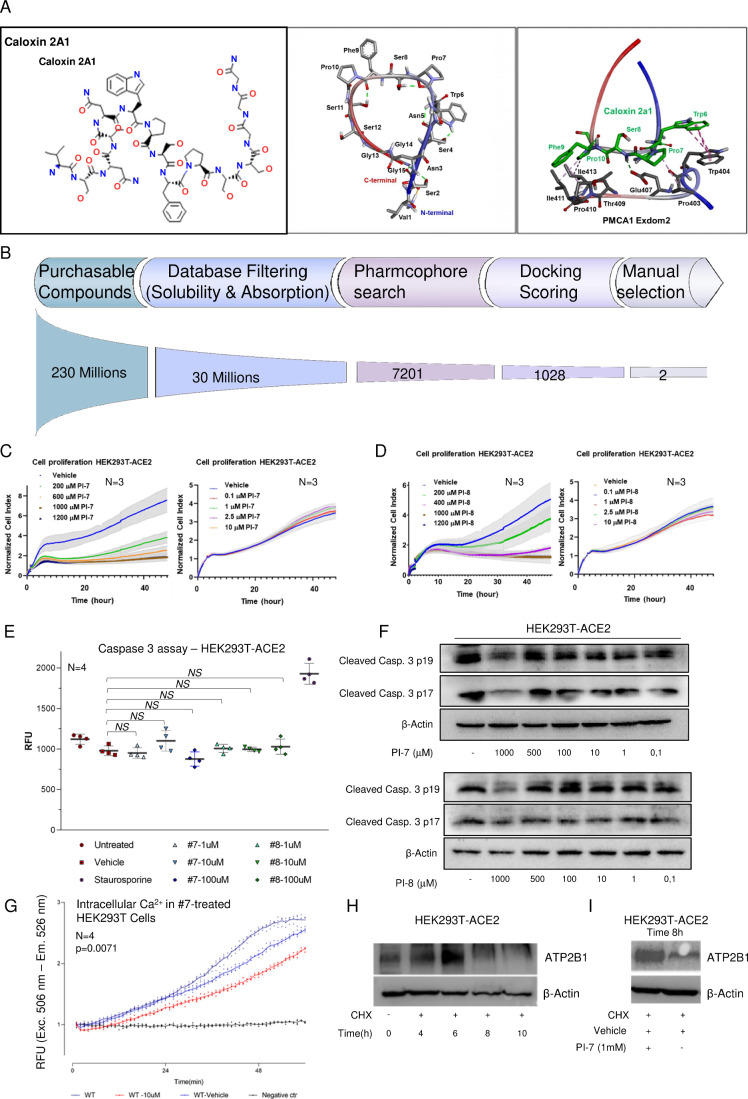
Figure EV4. ATP2B1 impairment using a nontoxic “caloxin derivative” (compound PI-7) impairs intracellular Ca2+ levels. Related to Fig. 4.
(A) On the left: The sequence of caloxin 2a1 sequence, as peptide, is shown. On the right: The molecular modeling of ATP2B1-caloxin 2a1 structure by docking and energy minimization modeling via artificial intelligence as a drug design computational tool is shown. The pharmacophore model by using the structures ATP2B1–exodom-2 and caloxin 2a1 is also shown. Five pharmacophore features were produced. (B) Pipeline of the drug discovery is shown as described in the manuscript. (C, D) Real-time cell proliferation analyses for the Cell Index (i.e., the cell-sensor impedance was expressed every two minutes as a unit called “Cell Index”). Results are expressed as means ± SEM of N = 3 biological replicates. HEK293T-ACE2 treatment described in the Methods are treated with escalating doses of PI-7 (C) or PI-8 (D); with vehicle-treated cells were the negative control. Impedance was measured every 2 min over 48 h. The graphs showing “normalized cell index” were generated using Graph Pad Prism 9. (E) Caspase-3 activity measured in HEK293T-ACE2 cells with increasing concentrations of compound PI-7 and PI-8 for 18 h. Vehicle-treated cells and cells treated with 10 µM staurosporine are used as negative and positive controls, respectively. Data are presented as relative fluorescent units (RFUs; excitation: 380 nm; emission: 460 nm). Results are expressed as means ± SEM of N = 3 biological replicates. NS not significant. One-way ANOVA test among multiple groups, Untreated vs. Vehicle P = 0.1596, Vehicle vs. PI-7-1 µM p = 0.9993, Vehicle vs. PI-7-10 µM P = 0.3039, Vehicle vs. PI-7-100 µM P = 0.5176, Vehicle vs. PI-8-1 µM P = 0.9992, Vehicle vs. PI-8-10 µM P > 0.9999, Vehicle vs. PI-8-100 µM P = 0.9732), NS not significant. (F) A representative immunoblotting analyses on total protein lysates obtained from HEK293T-ACE2 treated with escalating doses of PI-7 (top) and PI-8 (bottom) molecules using antibodies against Cleaved Caspase-3 fragments (17–19 kDa). β‐Actin is used as the loading control. Vehicle-treated cells are used as a negative control of the experiment. (G) Quantification of relative fluorescence changes of Fluo3-AM as a measure of intracellular Ca2+ levels for up to 48 min in HEK293T cells treated with 10 µM of PI-7, vehicle-treated cells were used as negative control. Results are expressed as means ± SEM of N = 4 biological replicates. Fd ANOVA global - CH test, P = 0.007. (H) A cycloheximide (CHX) chase assay, representative immunoblotting analyses on total protein lysates obtained from HEK293T-ACE2 treated with CHX at different time point (from T = 0 to T = 10 h) using antibodies against ATP2B1 and β‐Actin used as the loading control. Vehicle-treated cells (i.e., 0.001% DMSO) are used as negative control of the experiment. (I) A Representative immunoblotting analyses on total protein lysates obtained from HEK293T-ACE2 treated with CHX and PI-7 for 8 h, using antibodies against ATP2B1. β‐Actin is used as loading control. Vehicle-treated cells are used as negative control. Source data are available online for this figure

