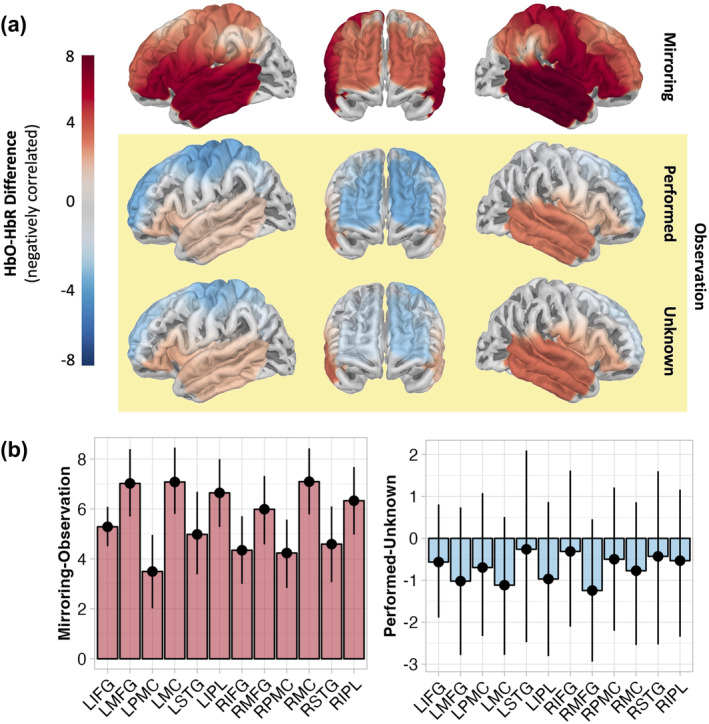
FIGURE 3.

(a) Projection of HbO–HbR difference estimates to surface of the brain per condition. (b) Contrasts per ROI between mirroring and observation of movement (performed and unknown aggregated) and between observation or performed and unknown movements. Points show difference and error bars show lower and upper HPD. Differences can be considered substantial where the HPD does not overlap with zero (all ROIs for Mirroring‐Observation), or only overlaps very minimally (LIFG, LSTG, and RSTG for Performed‐Unknown). Percentage of negatively correlated HbO–HbR difference values per ROI shown in Table S5 of Supplementary Materials A.
