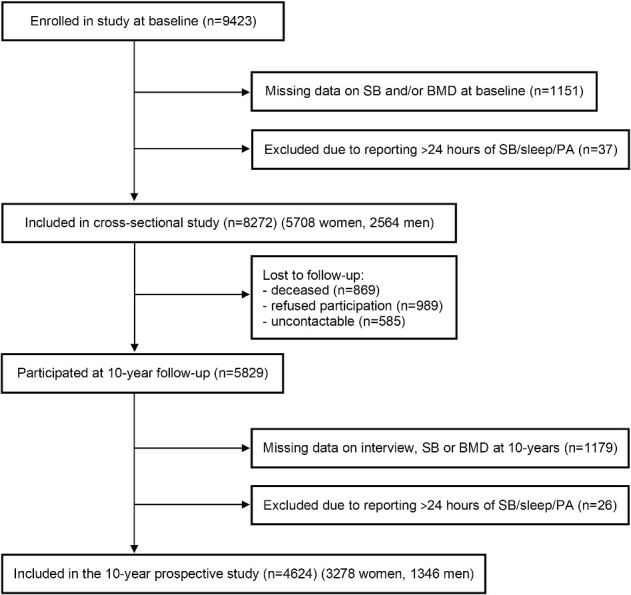
Figure 1.

Flow chart showing included Canadian Multicentre Osteoporosis Study participants aged ≥25 yr in cross-sectional and longitudinal analyses of sitting time (sedentary behavior), BMD, and incident fragility fracture.

Flow chart showing included Canadian Multicentre Osteoporosis Study participants aged ≥25 yr in cross-sectional and longitudinal analyses of sitting time (sedentary behavior), BMD, and incident fragility fracture.