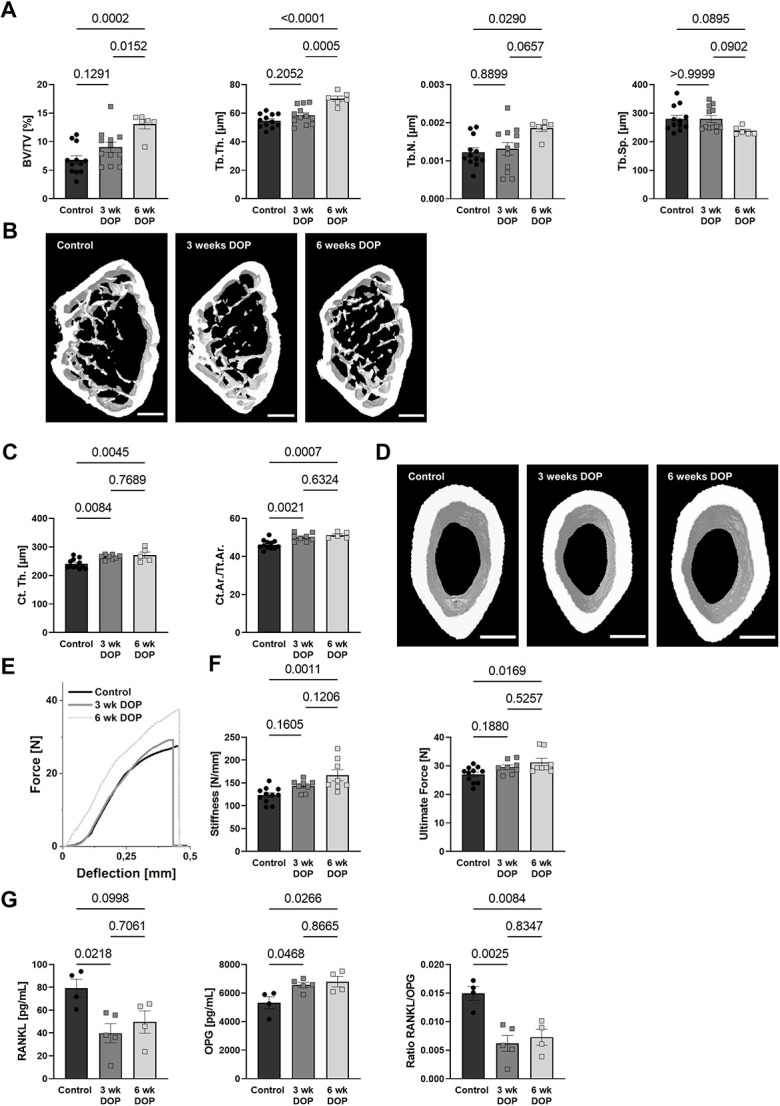
Figure 2.

S1P-mediated changes in the bone vasculature are followed by an increase in bone mass. (A) BV/TV, Tb.Th., Tb.N., and Tb.Sp. measured by μCT analysis of C57BL/6J mice after 3 and 6 wk of DOP treatment (3 mg/kg/d) and untreated controls (n = 12/12/6) and (B) representative images; scale bar = 500 μm. (C) Quantification of cortical thickness (n = 12/8/5) and cortical area per total tissue area (Ct.Ar./Tt.Ar); (D) representative images; scale bar = 500 μm. (E) Representative 3-point bending test graphs and quantification of (F) stiffness and ultimate force (n = 11/8/8). (G) RANKL and OPG plasma levels and the resulting RANKL/OPG ratio measured using ELISA (n = 4/5/4). Data are presented as mean ± SEM; one-way ANOVA was used for statistical analysis.
