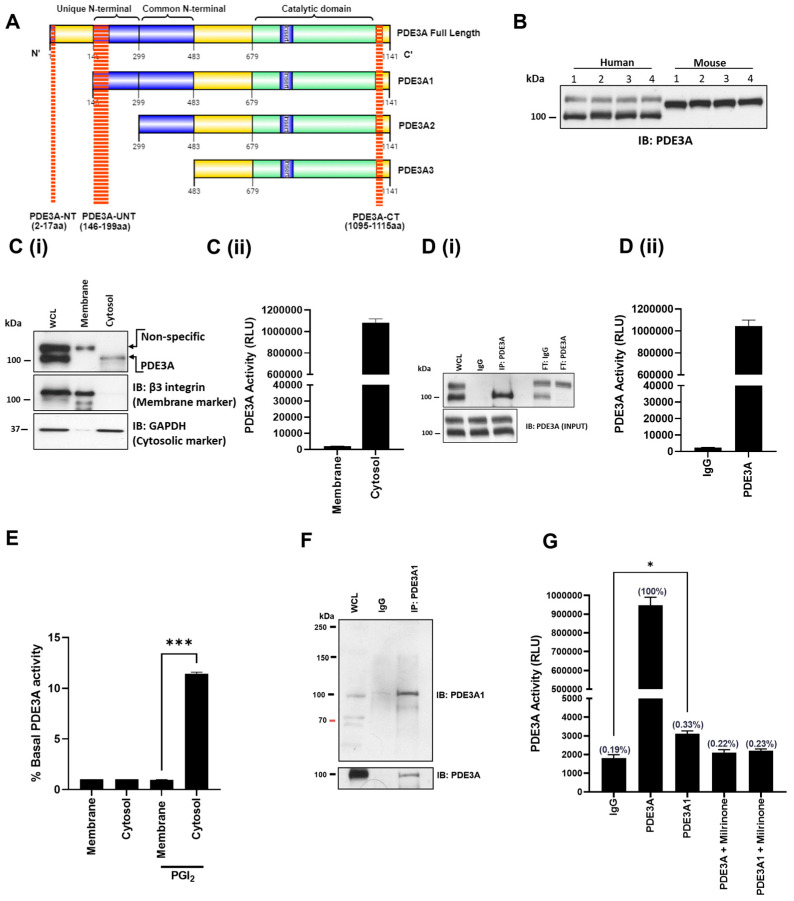
Figure 1.
Identification of PDE3A isoforms in blood platelets. (A) Schematic representation of PDE3A isoforms with N- and C-terminal domain architecture and antibody binding sites for PDE3A(NT), PDE3A(UNT), and PDE3A(CT). (B) Platelet lysates (5 × 10⁸ platelets/mL) from four human donors and four mice (C57BL/6 to8 weeks) were separated by SDS-PAGE and immunoblotted for total PDE3A using PDE3A(CT) antibody. (C(i)) Washed human platelets (5 × 10⁸ platelets/mL) were fractionated using liquid nitrogen and analysed for PDE3A localisation using immunoblotting. Blots were stripped and reprobed for the membrane marker, β3, and cytosolic marker, GAPDH, as fraction controls. Representative immunoblots of 3 independent experiments. (C(ii)) Fractionated PDE3A (500 µg protein) was immunoprecipitated and subjected to PDE3A activity assay. (D(i)) PDE3A was immunoprecipitated from washed human platelet lysates (500 μg protein) with PDE3A(CT) antibody (2 mg) or IgG and immunoblotted and assayed for PDE3A activity, in presence and absence of milrinone (10 μM, 20 min). (D(ii)) Data are expressed as relative luminescence units (RLU) and representative of 4 independent experiments. (E) Washed human platelets (5 × 10⁸ platelets/mL) were treated with PGI2 (100 nM) before fractionation using liquid nitrogen, immunoprecipitation of PDE3A was assayed for PDE activity. Data are presented as percentage increase over basal activity for each fraction (n = 3; *** p < 0.001). (F) Human platelet lysates (500 µg protein) were incubated with PDE3A(UNT) antibody (10 μg) for 1 hr before incubated overnight with 25 µL protein G Sepharose beads slurry. Following incubation, immunoprecipitated proteins were isolated and immunoblotted with PDE3A(UNT) and PDE3A(CT) antibodies. Whole cell lysates were run as input controls. Representative immunoblots of 3 independent experiments. (G) Respective immunoprecipitated PDE3A proteins from washed human platelet lysates (500 μg protein) and assayed for PDE3A activity, in presence and absence of milrinone (10 μM, 20 min). Data are expressed as relative luminescence units (RLU) and representative of 3 independent experiments (* p < 0.05 compared to IgG).

