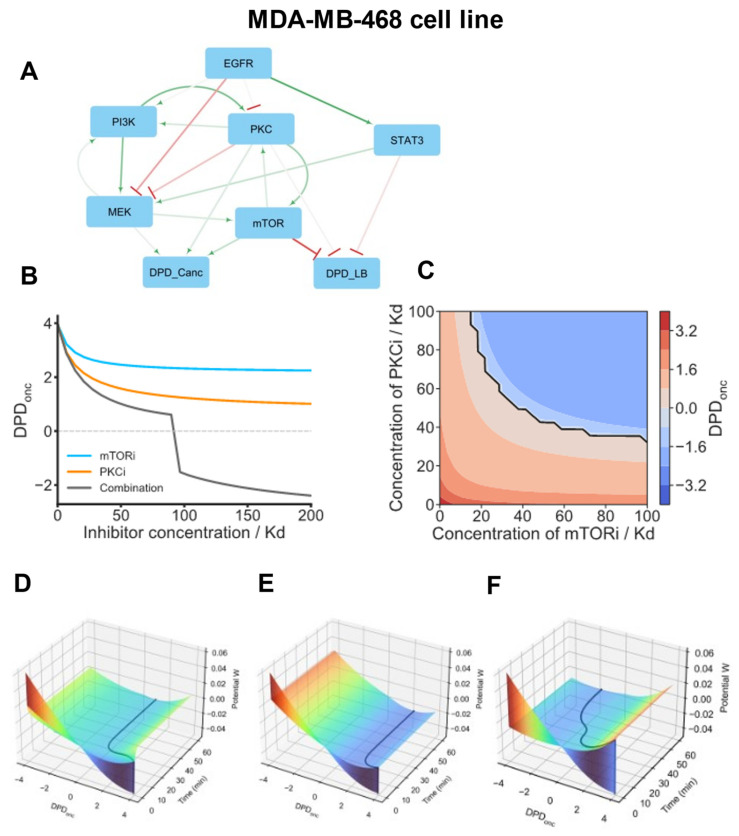
Figure 4.
cSTAR model of the MDA-MB-468 cell line. (A) BMRA-reconstructed topology of the core signaling network and the connections to the DPD modules at the late time points for the MDA-MB-468 cell line. Activation and inhibition are indicated by green arrowheads and red barheads, respectively. The darker the color, the higher the absolute value of the connection coefficient. (B) Dose responses of the DPDonc scores to mTOR, PKC inhibitors (mTORi, PKCi), and their combination. In the drug combination, the ratio of mTORi and PKCi doses is 1:1, with each inhibitor dose being 50% of the corresponding dose when the inhibitors are applied separately. (C) Predictive simulations of the Loewe isoboles demonstrate synergy in a combination of mTORi and PKCi. Solid black line represents a borderline between normal and oncogenic states, i.e., DPDonc = 0. (D–F) Model-predicted maneuvering of the MDA-MB-468 cell in Waddington’s landscape (shown by black lines). Surface colors represent the values of Waddington’s potential. After model variables reached the equilibrium, the following inhibitor doses were added at t = 0 individually or in a combination; 100 Kd PKCi (D), 100 Kd mTORi (E), or 50 Kd PKCi + 50 Kd mTORi (F). (D,E) PKCi and mTORi applied as single drug treatments do not normalize the phosphoproteomic cell patterns. (F) By combining these inhibitors in twice lower doses, the DPDonc trajectory shows a switch from positive DPDonc scores to negative DPDonc scores, which correspond to non-malignant breast tissue cells.

