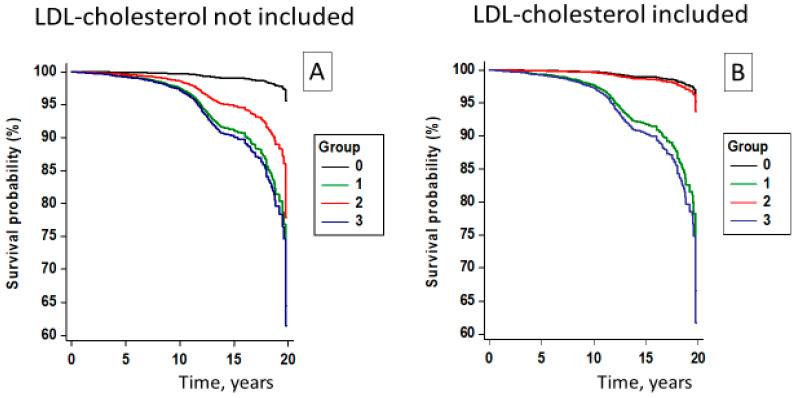
Figure 2.
Survival curves for risk of major adverse cardiovascular events in the participants <70 years of age stratified according to BMI and metabolic status. Metabolic status was defined with standard criteria (panel (A)) or including LDL-cholesterol level (panel (B)). The risk was calculated from multivariable Cox regressions adjusted for age, sex, smoking, serum creatinine, and uric acid. Group 0 indicates participants with normal body weight and healthy metabolic status; Group 1, participants with normal body weight and unhealthy metabolic status; Group 2, participants who were overweight/obese and with healthy metabolic status; Group 3, participants who were overweight/obese and with unhealthy metabolic status.

