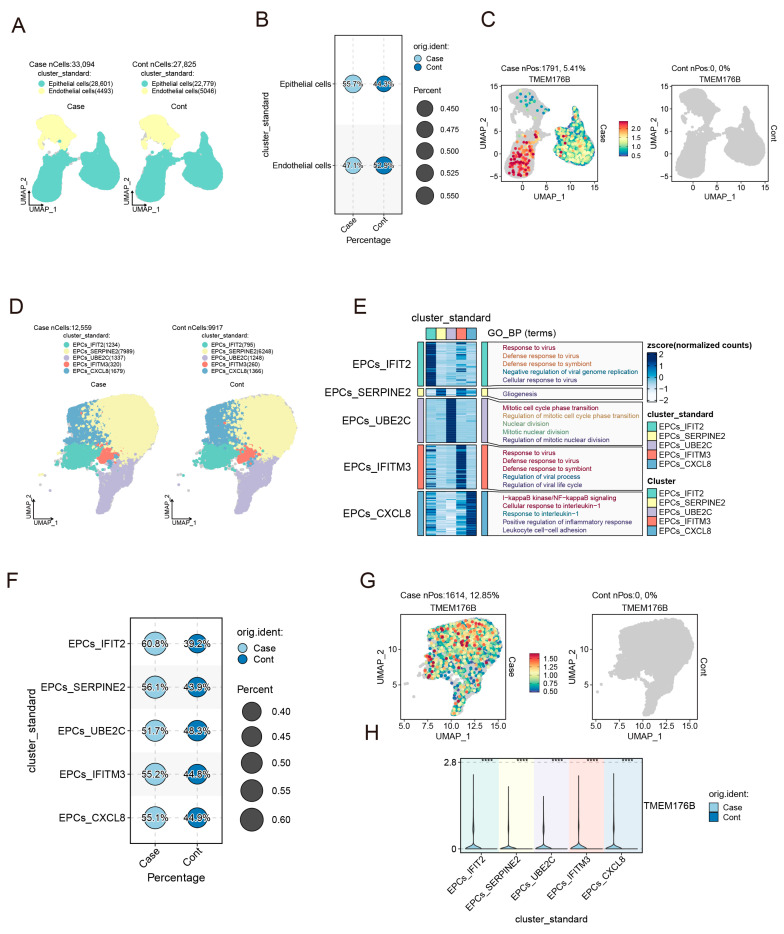
Figure 3.
Cell population of co-cultured PC9 and HUVEC cells. (A) UMAP of total cells. (B) Percentage of cell compositions. (C) TMEM176B expression patterns in Case and Cont. (D) Subgroup of epithelial cells and their major GO term (E). (F) Composition percentage of each subgroup. (G) TMEM176B expression in the subgroup of epithelial cells. (H) The expression percentage of TMEM176B in the epithelial subgroup. ****, p < 0.0001.

