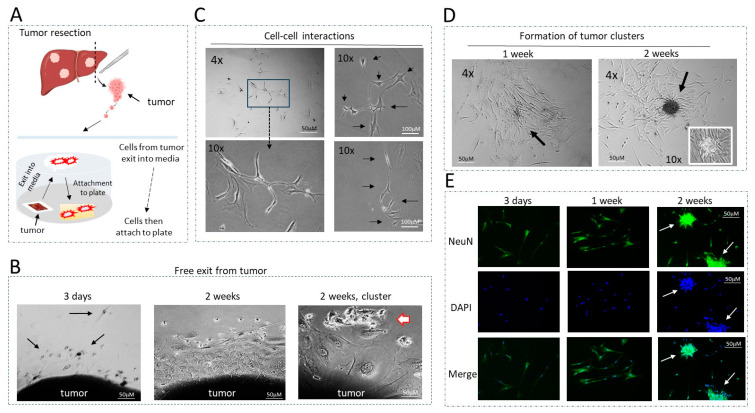
Figure 3.
Generation and general description of patient-derived cells with metastatic activities. (A) A diagram showing the “cell free exit” protocol for generation of cultured cells. (B) Examples of the exit of cells from tumors at 3 days, 1 week and 2 weeks. Arrows show exiting cells with the shape of neurons. (C) Examples of cell–cell interactions. Images show physical interactions between 5 and 6 cells. Arrows show cells that interact with each other. (D) Examples of tumor cluster formation in one week and two weeks post-plating. Arrows point to the center of a cluster under 10× magnification. (E) NeuN staining of the hbl cell lines at different stages of tumor cluster formation. Arrows show NeuN-positive clusters.

