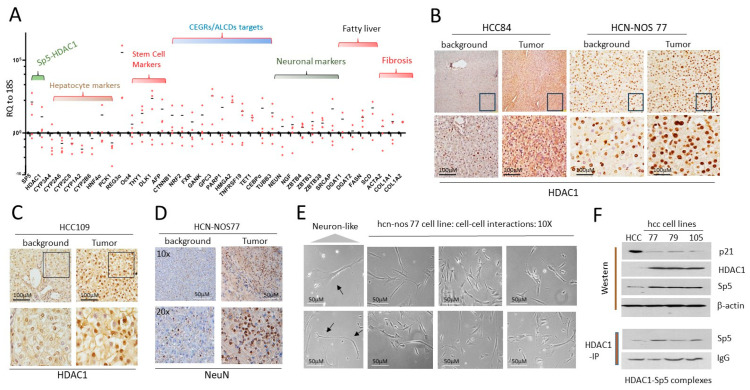
Figure 6.
Generated hcc/hcn-nos cell lines maintained elevated HDAC1-Sp5 pathway observed in original liver tumors. (A) QRT-PCR analysis of HCC tumors from 4 patients. (B) Staining of the liver tumor of HCC84 and HCN-NOS77 patients with HDAC1. (C) Staining of HCC109 to HDAC1. (D) Staining of the liver tumor of HCN-NOS77 patient for NeuN. (E) Images of cells in hcn-nos77 cell line. The cells show intensive interactions with each other. Arrows show cells that have the shape of neurons. (F) Western Blot (upper) and Co-IP (HDAC1-IP, (bottom)) show that the generated cell lines preserved the increased HDAC1-Sp5 pathway. The whole gel images of western blots can be found in File S1.

