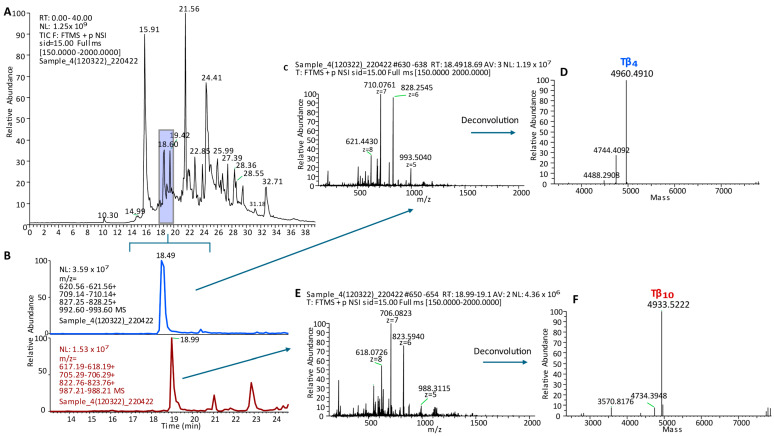
Figure 3.
Panel (A): High-resolution (Orbitrap) HPLC-ESI-MS profile of the acidic soluble fraction of whole saliva from preterm newborns (233 days of post-conceptional age (PCA)). The elution range (18–20 min) where Tβ4 and Tβ10 elute is evidenced by the colored box. Panel (B): XIC (eXtracted Ion Current) peaks were revealed by selecting four multicharged ions from [M + 8H+]8+ to [M + 5H+]5+ of Tβ4 (upper lane) and Tβ10 (bottom lane). The ESI spectrum and the corresponding deconvolution of Tβ4 are shown in Panels (C,D), respectively. The ESI spectrum and the corresponding deconvolution of Tβ10 are shown in Panels (E,F), respectively. Deconvolutions allowed us to determine the experimental M (monoisotopic) of Tβ4 (Panel (D), theor. 4960.486) and Tβ10 (Panel (F), theor. 4933.523).

