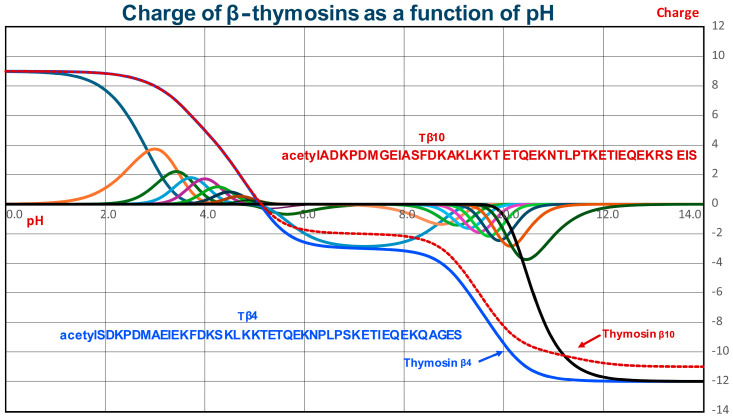
Figure 6.
Charge of β-thymosins as a function of pH (blue line, Tβ4; dashed red line, Tβ10). The curves were obtained as reported in [17]. The two lines resulted from the summation of the molar fractions of the 22 charged species multiplied for their charge (from +9 to −12, reported with different colors only for Tβ4). For simplicity, the molar fractions of the 21 charged species of Tβ10 (from +9 to −11) are not shown.

