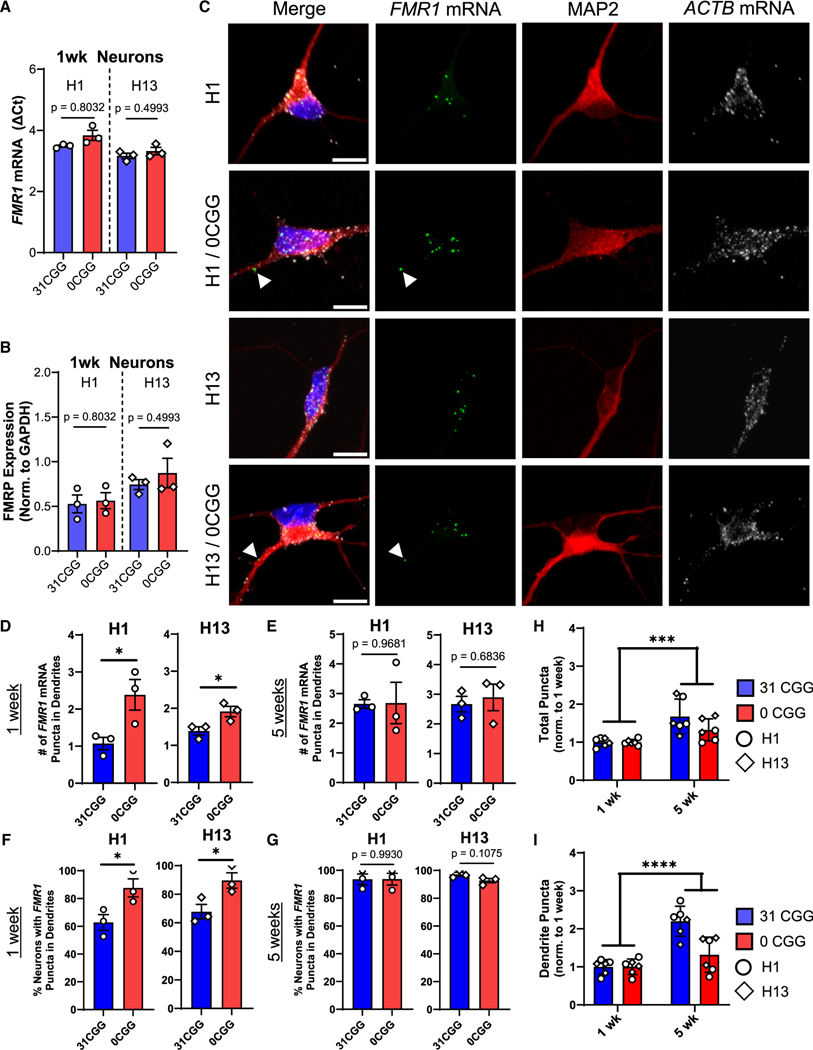
Figure 1. Removal of CGG repeats promotes localization of FMR1 mRNA to dendrites of early post-mitotic neurons.
(A and B) FMR1 mRNA levels (A) and FMRP protein levels (B) in hESC-derived neurons at 1 week of differentiation. See Figure S1J for representative blot images. n = 3 independent batches of differentiation per line.
(c) Representative confocal images showing FMR1 and ACTB mRNA puncta in hESC-derived neurons stained for post-mitotic neuron marker, MAP2 (red). Blue, nuclear staining using DAPI. Scale bar, 10 μm.
(D and E) Quantification of the number of FMR1 mRNA puncta in the dendrites of neurons. n = 3 technical replicates from a single batch of neurons for N = 2 isogenic hESC lines. Each data point represents the average of ≥11 neurons.
(F and G) Percentage of neurons containing at least 1 FMR1 mRNA puncta in their dendrites at 1 week (F) and at 5 weeks (G).
(H and I) Comparison of total FMR1 mRNA puncta (H) and dendritic FMR1 mRNA puncta (I) in 1 week versus 5 week neurons, with all data normalized to the 1-week time point. n = 3 technical replicates from a single batch of neurons for N = 2 isogenic hESC lines. Each data point represents the average of ≥11 neurons. Error bars indicate SEM. (A, B, and D–G): two-tailed Student’s t test *p < 0.05. (H and I) Two-way ANOVA, significant main effect of time; ***p < 0.005, ****p < 0.001.

