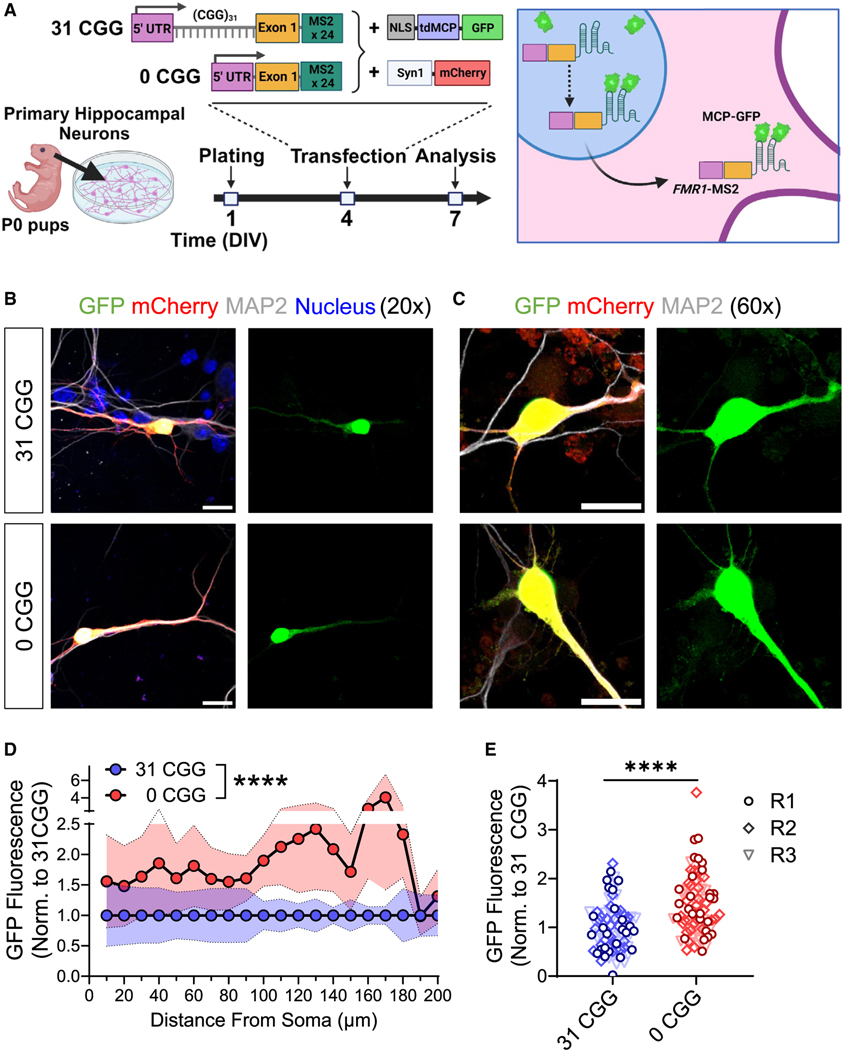
Figure 2. Expression of the human FMR1 5′ UTR in mouse neurons recapitulates CGG repeat-mediated differences in dendritic mRNA localization.
(A) Schematic illustration of transfection of primary mouse hippocampal neurons with MS2 and Syn1-mCherry constructs and timing of experiments.
(B and C) Representative confocal images of MS2-transfected neurons at 20× magnification (B) and 60× magnification (C). Scale bars, 25 μm (B), 20 μm (C). Green, MS2-reporter; red, Synapsin-mCherry reporter; white, MAP2 (post-mitotic neuron label; blue, nuclear staining using Hoechst.
(D) Quantification the GFP fluorescence intensity along the length of primary dendrites of GFP+/mCherry+/MAP2+ neurons. Shaded area indicates SEM.
(E) Summation of the fluorescence intensity in primary dendrites, normalized for dendritic length. Each data point represents single neurons. Data in D and E are from N = 3 independent neuronal isolations/biological replicates (R1–R3; 22–29 neurons per replicate). Values were normalized to 31 CGG condition for each batch of neurons. (D) Two-way ANOVA, significant main effect of genotype ****p < 0.001. (E) Welch’s t test ****p < 0.001.

