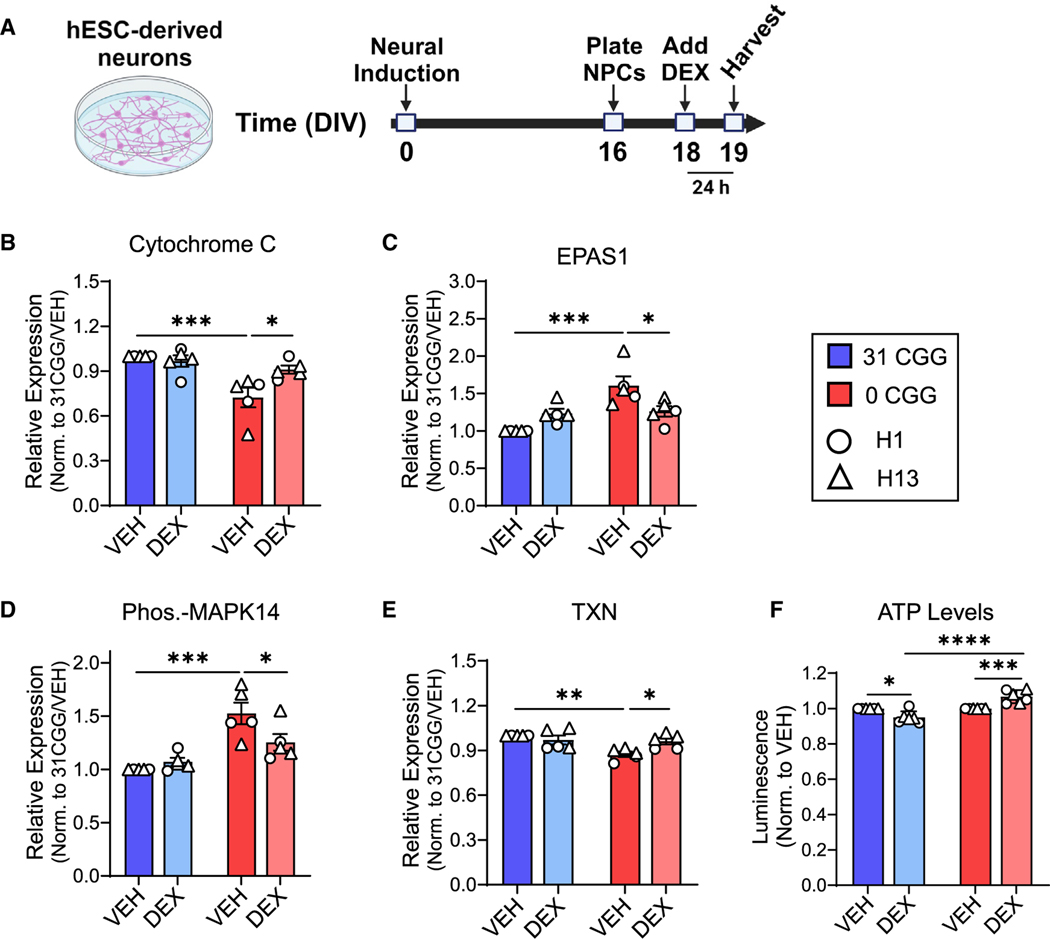
Figure 5. Removal of CGG repeats from the FMR1 5’ UTR leads to altered cellular stress and response to GR activation.
(A) Schematic showing the timing of DEX treatment in hESC-derived neurons.
(B–E) Quantification of total protein levels in VEH-treated versus DEX-treated neurons: cytochrome c (B), EPAS1 (C), phosphorylated-MAPK14 (D), and TXN (E). Data are from n = 5 independent neuronal differentiations from N = 2 cell lines.
(F) ATP levels in DEX-treated neurons. (Left) H1 and H1–0CGG. (Right) H13 and H13–0CGG. Data shown are from n = 3 independent neuronal differentiations per line. DEX data point for each batch of cells was normalized to matched VEH control. Error bars indicate SEM. (B–F) Two-way ANOVA with Tukey’s multiple comparison’s test; *p < 0.05, **p < 0.01, ***p < 0.005, ****p < 0.001.

