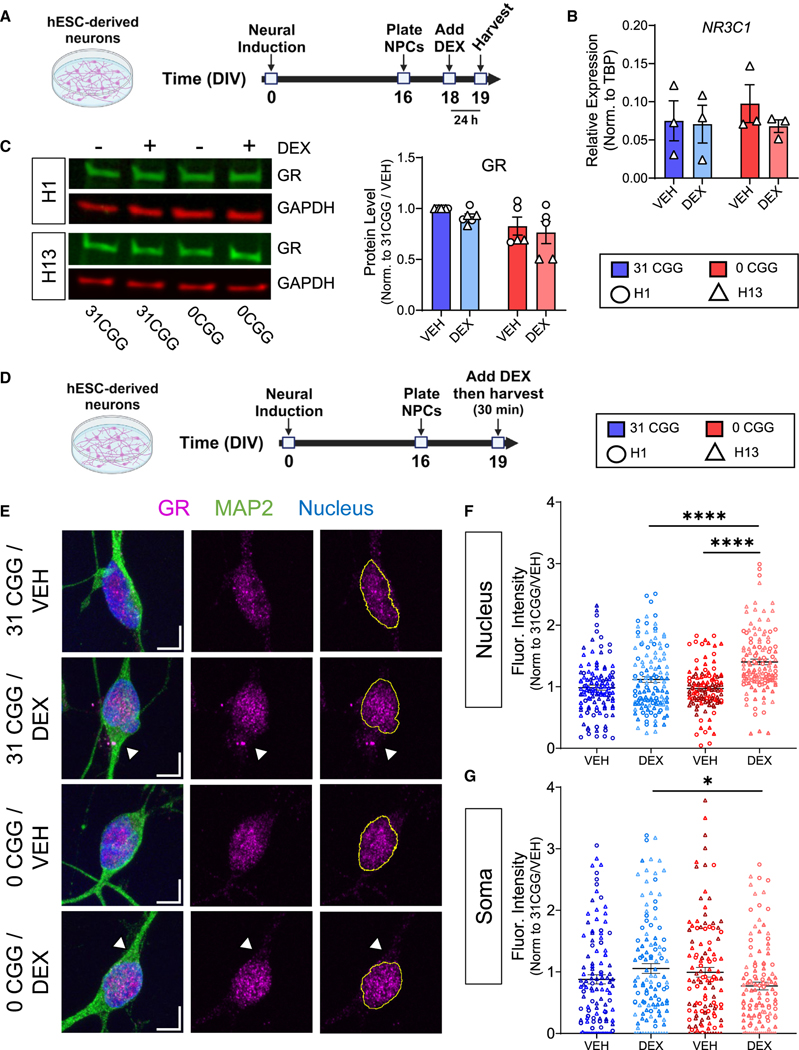
Figure 6. Removal of CGG repeats from the FMR1 5’ UTR affects GR subcellular localization after DEX treatment.
(A) Schematic showing the timing of DEX treatment in hESC-derived neurons.
(B) qRT-PCR data showing NR3C1 mRNA levels in H13 and H13–0CGG neurons. n = 3 independent differentiations. Error bars indicate SEM.
(C) GR protein levels in DEX-treated hESC-derived neurons. (Left) Representative western blot images from H1 and H13 neurons. (Right) Quantification of GR protein levels. n = 5–6 independent batches of differentiation from N = 2 cell lines. Data shown are normalized to 31 CGG-VEH condition. Error bars indicate SEM.
(D) Schematic showing the timing of acute DEX treatment of hESC-derived neurons.
(E) Representative confocal images of the GR receptor expression in MAP2+ neurons. Scale bars, 5 μm. Arrowheads demonstrate differences in soma GR signal in DEX-treated 31CGG and 0CGG neurons. Magenta, GR; green, MAP2 (postmitotic neuron marker); blue, nuclear staining using Hoechst.
(F and G) Quantification of GR fluorescent signal in nucleus (F) and soma (G). n = 111–125 individual neurons from N = 2 cell lines. (B and C) Two-way ANOVA. (F) Brown-Forsythe and Welch ANOVA test followed by Games-Howell’s multiple comparison’s test, ****p < 0.001. (G) One-way ANOVA followed by Tukey’s multiple comparison’s test, *p < 0.05.

