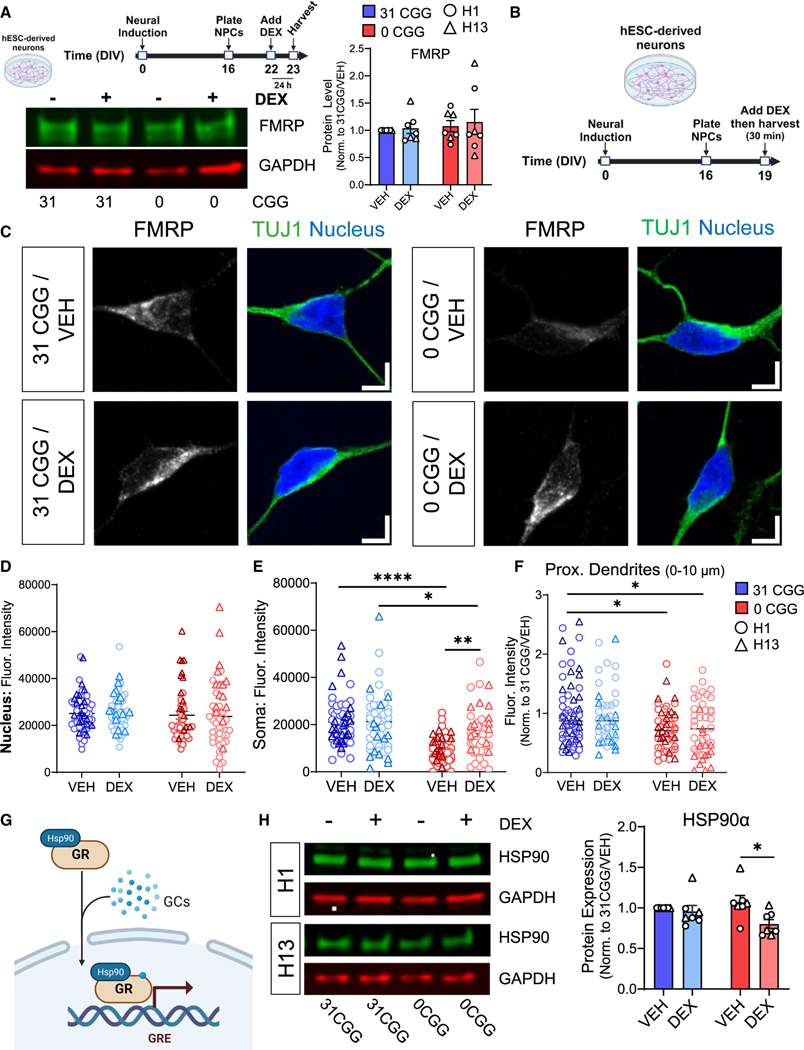
Figure 7. Removal of CGG repeats from the FMR1 5′ UTR leads to decreased levels of GR chaperone protein HSP90α following DEX treatment.
(A) Total FMRP levels in neurons treated with DEX for 24 h. (Top left) A schematic diagram showing the timeline for DEX treatment. (Bottom left) Representative western blots from H13 and H13–0CGG neurons treated with DEX. (Right) Quantification of FMRP protein levels from Western blots. n = 7 technical replicates from N = 2 isogenic pairs of cells (three independent batches of differentiation and DEX treatment per line). Error bars indicate SEM.
(B) Schematic showing the timing of DEX treatment in hESC-derived neurons.
(C) Representative confocal images showing FMRP localization in TUJ1+ (green) neurons. (Left) 31 CGG. (Right) 0 CGG. Blue, nuclear staining using Hoechst. Scale bar, 5 μm.
(D–F) Quantification of FMRP signal in the nucleus (D), soma (E), and proximal dendrites (first 10 μm proximal to soma, F). Data shown in (F) are normalized to 31 CGG-VEH condition. (D and E) n = 48–57 neurons from N = 2 cell lines. (F) n = 44–60 neurons from N = 2 cell lines.
(G) Schematic illustrating the role of chaperone protein HSP90α in GR nuclear translocation.
(H) HSP90α protein levels in DEX-treated hESC-derived neurons. (Left) Representative western blots from H1 and H13 neurons treated with DEX. (Right) Quantification of GR protein levels. n = 7 independent batches of differentiation from N = 2 cell lines. Error bars indicate SEM. (A, D–F, and H) Two-way ANOVA followed by Tukey’s multiple comparison’s test, *p < 0.05, **p < 0.01, ****p < 0.001.

