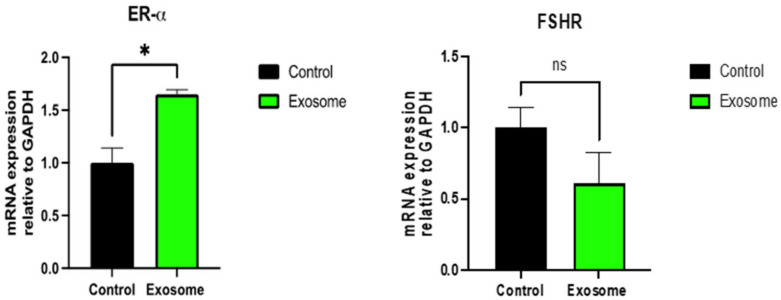
Figure 3.
The relative changes in the gene expression of ER-alpha (left) and FSHR (right) in ex-vivo exosome-treated ovary relative to the untreated control were quantified by the 2−ΔΔCT method. * indicate statistical significance according to student t-test (p < 0.05); ns: nonsignificant. The bar graphs represent the mean ± SEM of three technical replicate measurements of three independent biological replicates from three different patients.

