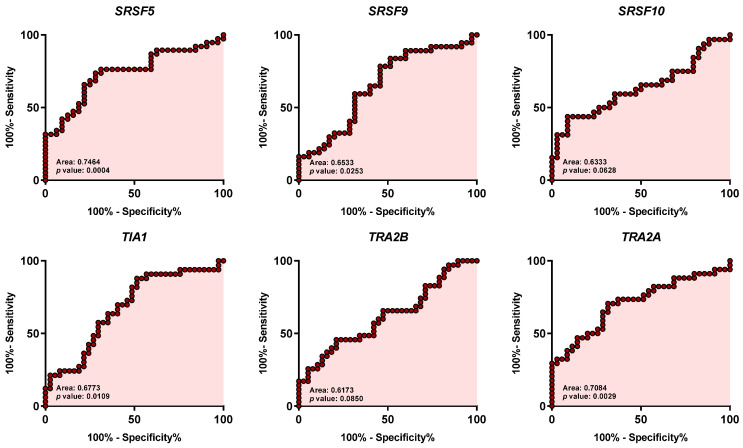
Figure 2.
Receiver Operating Characteristic (ROC) curve analysis of significantly dysregulated splicing machinery components in OSCC samples compared with non-tumoral adjacent tissue. Specific AUC (Area Under the ROC Curve) obtained ranged from 0.617 to 0.810 [i.e., SRSF10 (0.6333: p = 0.0628), SRSF9 (0.6533: p = 0.0253), SRSF5 (0.7464: p = 0.0004), TRA2A (0.7084: p = 0.0029), ESRP2 (0.8104: p < 0.0001), RBM10 (0.7860: p < 0.0001), ESRP1 (0.7793: p < 0.0001), RBM3 (0.7455: p = 0.0003), NOVA1 (0.7851: p < 0.0001), TRA2B (0.6173: p = 0.0850), TIA1 (0.6773: p = 0.0109), and SRSF4 (0.6416: p = 0.0448)].

