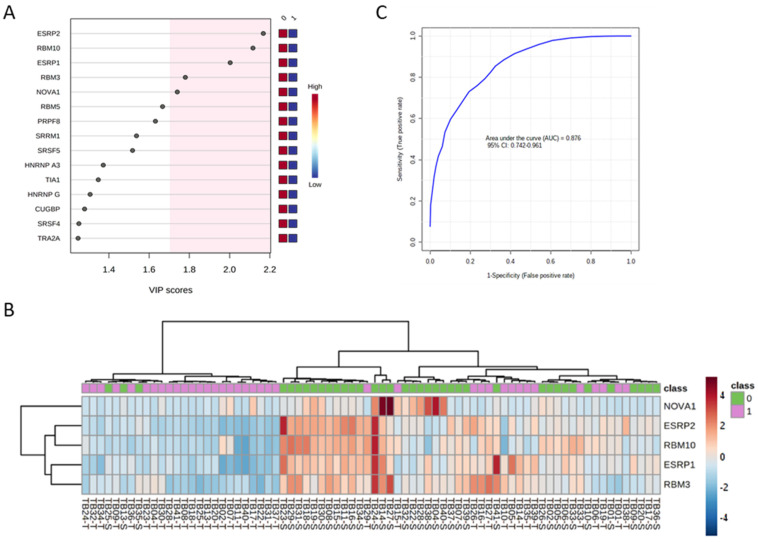
Figure 3.
Discriminatory value of the top 5 genes of splicing machinery components and splicing factors in OSCC (ESRP1, RBM10, ESRP2, RBM3, and NOVA1). (A) VIP scores obtained from Partial Least Squares Discriminant Analysis (PLS-DA) of the spliceosome components analyzed in OSCC vs. non-tumoral adjacent tissues. (B) Unsupervised clustering analysis of mRNA expression levels of the 5 top discriminating spliceosome components and splicing factors (ESRP1, RBM10, ESRP2, RBM3, and NOVA1; shown as a hierarchical heatmap) in OSCC samples (1: shown in green) compared with non-tumoral adjacent tissue (0: shown in red). (C) Receiver operating characteristic (ROC) curve analysis with the expression levels of the 5 top discriminating spliceosome components and splicing factors (ESRP1, RBM10, ESRP2, RBM3, and NOVA1).

