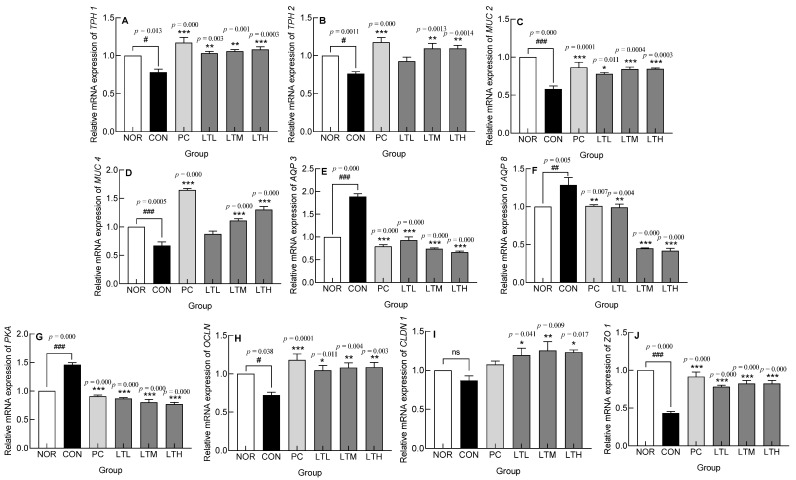
Figure 6.
Effect of lactitol on gene expression levels of (A) Tryptophan hydroxylases (TPH)1, (B) TPH2, (C) Mucin (MUC)2, (D) MUC4, (E) Aquaporin (AQP)3, (F) AQP8, (G) Protein kinase A (PKA), (H) Occludin (OCLN), (I) Claudin (CLDN) and (J) Zonula occludens 1 (ZO1) in colon tissues of Sprague Dawley (SD) rats with loperamide-induced constipation. NOR: normal group; CON: loperamide-control group (5 mg/kg), PC: lactulose (2010 mg/kg) treated with loperamide; LTL: low dose of lactitol (300 mg/kg) treated with loperamide; LTM: medium dose of lactitol (500 mg/kg) treated with loperamide; LTH: high dose of lactitol (800 mg/kg) treated with loperamide. # p < 0.05, ## p < 0.01 and ### p < 0.001 vs. NOR, and * p < 0.05, ** p < 0.01 and *** p < 0.001 vs. CON in mRNA expression.

