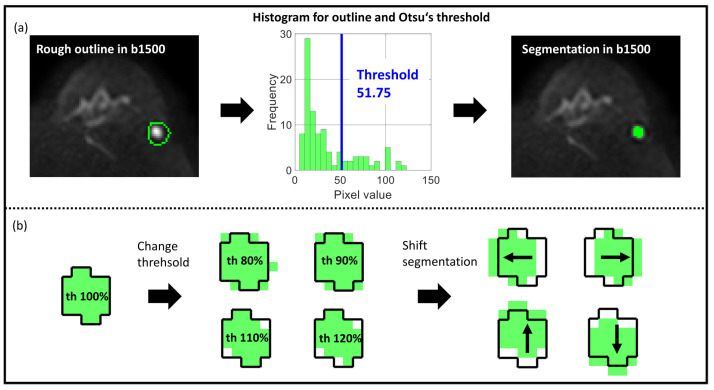
Figure 1.
Otsu’s threshold method for segmentation. (a) Segmentation workflow with rough delineation in the b1500 image to simplify the thresholding process, Otsu’s threshold in the histogram, and final segmentation in the b1500 image. (b) Two variations of original segmentation (th = 100%): Resize by changing threshold (th = 80%, th = 90%, th = 110%, th = 120%) and shift of segmentation by one pixel (shift x1, shift -x1, shift y1, shift -y1). Bright green area in (b) indicates the segmentation mask, the dark lined area the lesion as segmented with th = 100%, the arrows show the direction in which the segmentation is shifted.

