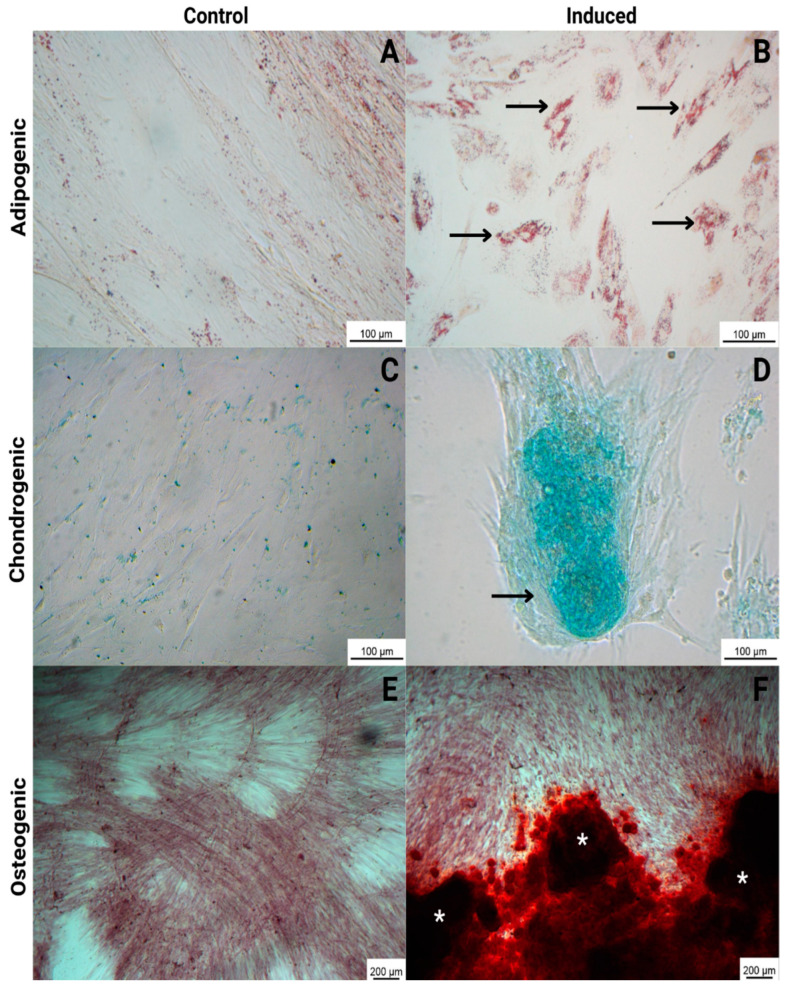
Figure 2.
Trilineage differentiation of WJ-MSCs, comparing control (non-induced cells) and induced cells. Adipogenic: with lipid deposition in the cytoplasm of the cells detected by staining with oil red O (black arrows) (B); chondrogenic: with proteoglycan deposition detected by staining with alcian blue (black arrow) (D); and osteogenic: with calcium deposition detected by staining with alizarin red (white asterisks) (F). The control cells (non-induced) were negative for all staining procedures (A,C,E). The images were obtained via optical microscopy (Carl Zeiss Microscopy, Zeiss, Jena, Germany).

