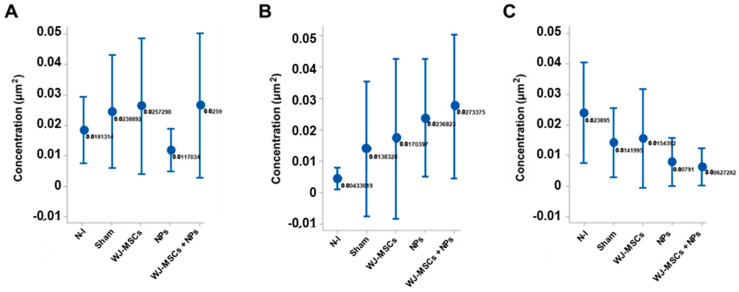
Figure 11.
Cytokine concentration per square micrometer. (A) IL-4 concentration in the different analyzed groups, with no statistical difference (n = 8); (B) IFN-γ concentration among the groups, with no statistical difference (n = 8); (C) TNF-α concentration in the different groups, without statistically significant difference (n = 8). The results are from ANOVA analysis with Tukey’s post-test, displayed as mean ± standard error, and with p < 0.05. Non-induced group (N-I), Wharton’s jelly mesenchymal stem cells (WJ-MSCs), and neural precursors (NPs).

