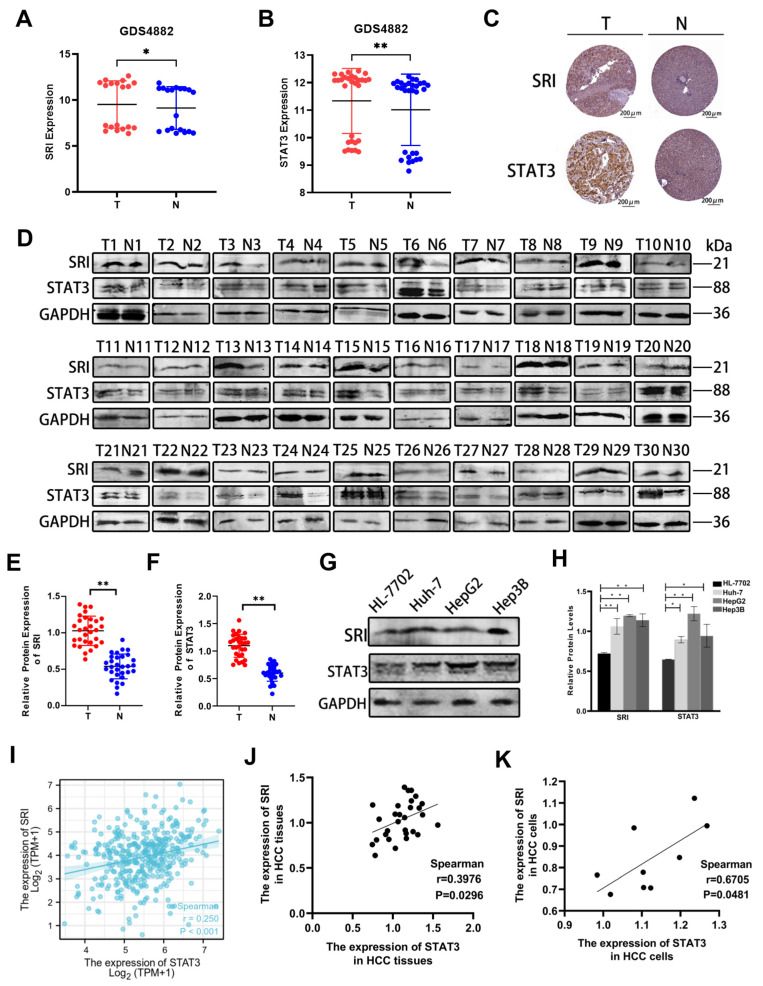
Figure 1.
SRI and STAT3 are upregulated both in HCC tissues and cells. (A,B) SRI and STAT3 are highly expressed in HCC tissues (T) compared with normal liver tissues (N) in the GEO database (GDS4882). (C) Image available from Proteinatlas database showed high expression of SRI and STAT3 in tumor (T) compared with normal liver tissues (N). The expression of proteins were determined by the brown area. Scale bars = 200 μm. (D–H) Western blot showed SRI and STAT3 proteins were overexpressed in clinical HCC tissues and in Huh-7/HepG2/Hep3B cells. The red and blue spots represented the expression of different proteins in the T and N groups, respectively. (I) From the TGGA database, SRI was found to be positively correlated with STAT3 in LIHC (p < 0.001). (J,K) The expressions of SRI and STAT3 are positively correlated in HCC tissues and cells lines (p < 0.05). * p < 0.05, ** p < 0.01.

