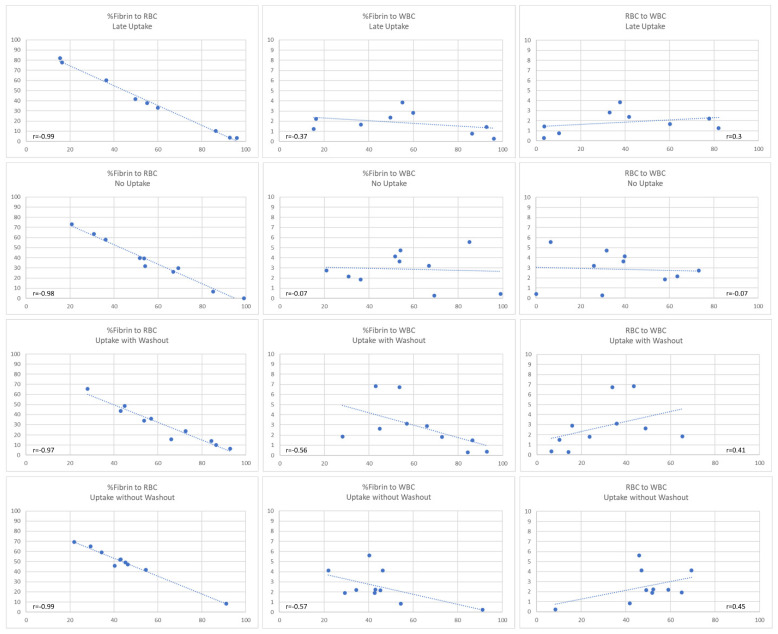
Figure 3.
Graphic representation of Pearson correlations between fibrin/platelets (labeled as fibrin in the graph), red blood cells (RBCs) and white blood cells (WBCs). Correlations between fibrin/platelet to RBC, fibrin/platelet to WBC and RBC to WBC grouped into four categories according to the measured contrast agent uptake characteristics are shown. A moderate relationship between RBCs and WBCs in the uptake without washout (r = 0.45) and the uptake with washout category (r = 0.41) is seen. The Pearson correlation coefficient (r) measures the strength and direction of a linear relationship between the two variables.

