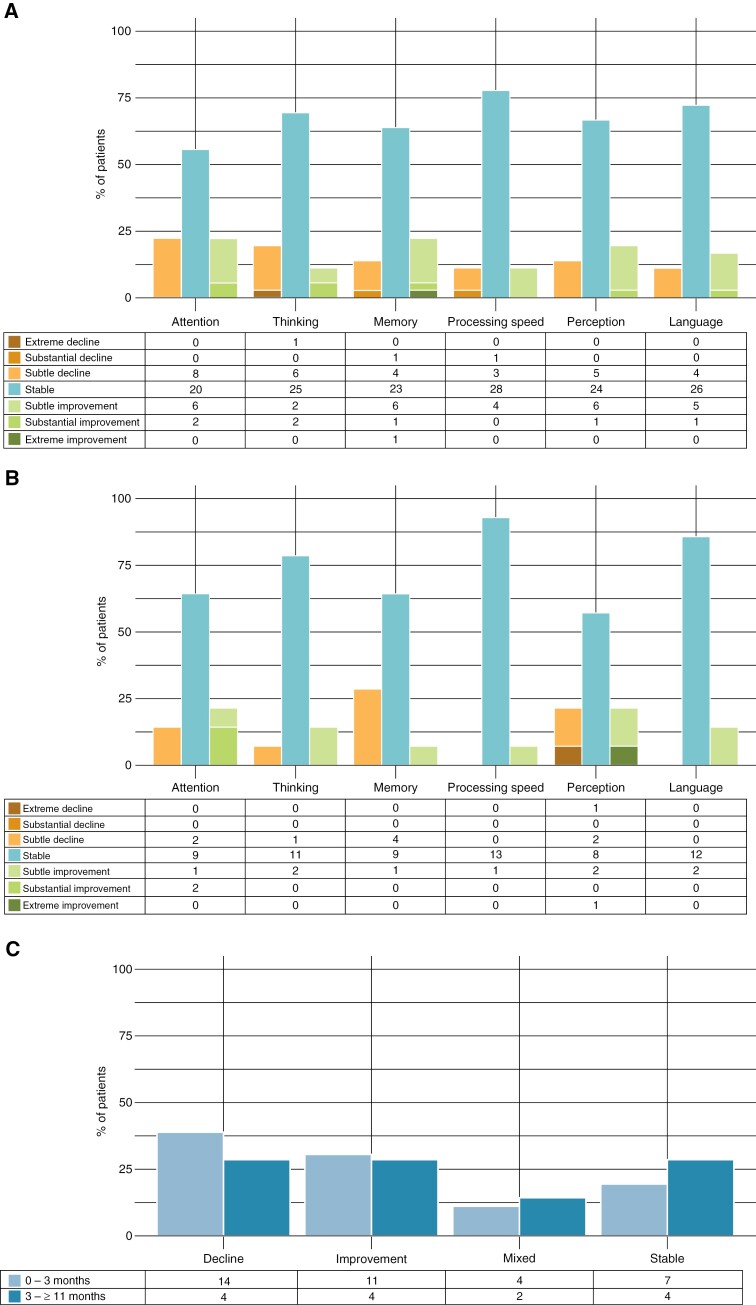
Figure 2.
Change in subjective cognitive performance calculated from (a) baseline-3 months and (b) 3 to ≥11 months at the domain-level and (c) at overall-level. Tables below the graph indicate the number of patients. Note: stable performance (±5), subtle improvement or decline (±6 to 25), substantial improvement or decline (±26 to 50), and extreme improvement or decline (±>50).

