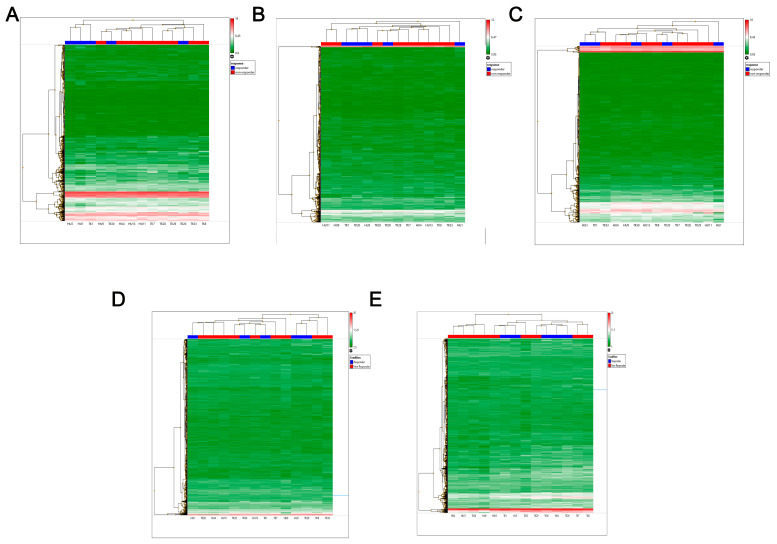
Figure 2.
Heatmap of unsupervised cluster analyses depicting expression of (A) mature miRNAs, (B) pre-miRNAs, (C) snoRNAs and scaRNAs, (D) lncRNA and (E) coding genes in ccRCC cases. The dendrogram at the side shows the distribution of the RNAs, and at the top the relationship between patient samples (blue responder and red non-responder) is shown.

